
Figures & data
Figure 1 Flow diagram of patient inclusion and exclusion.
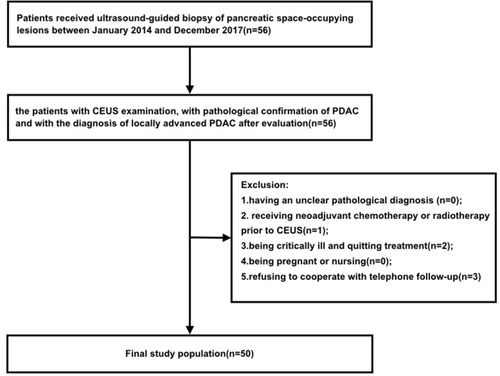
Table 1 Patients’ Clinical Data, with Comparisons Between the Data for the Two PDAC Patient Groups with Different CEUS Enhancement Patterns (n = 56) and for the Patients with Different Degrees of Differentiation (n = 26)
Figure 2 CEUS enhancement patterns in the arterial phase in PDAC. (A and B): A 53-year-old male patient with PDAC located in the head of the pancreas. Rapid iso-enhancement was observed in the arterial phase of CEUS (18 s) (as shown by the white arrows). (C and D): A 42 year-old male patient with PDAC located in the body of the pancreas. Hypo-enhancement was observed in the arterial phase of CEUS (15 s), and no areas of enhancement were visible within the tumour (as shown by the white arrows).
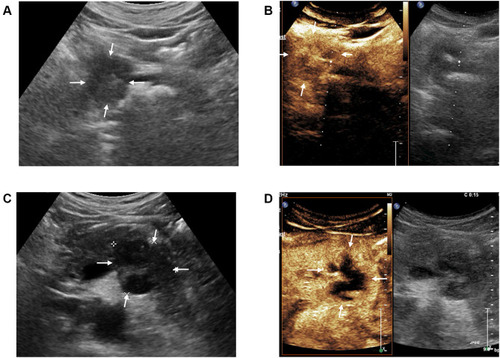
Table 2 Comparison of Sex, Age at Disease Onset, Size of Lesions, and CA19-9 Level for PDAC Patients with Different Enhancement Patterns
Table 3 Survival of PDAC Patients with Different Enhancement Patterns Based on Follow-Up Results
Figure 3 Survival analysis of the hypo- and iso-enhancement groups.
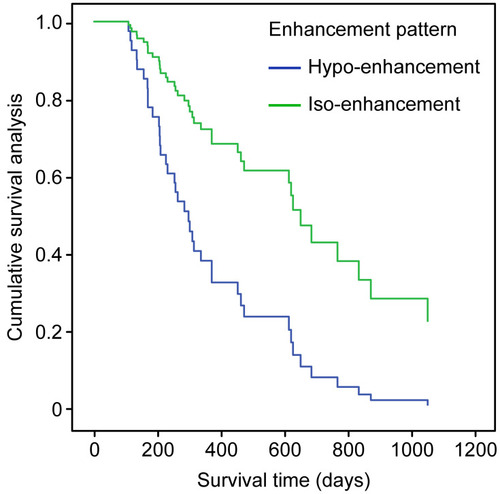
Table 4 Comparison of TIC Parameters Between Different CEUS Enhancement Patterns of PDAC