Figures & data
Table 1 Baseline Characteristics of Study Participants
Figure 1 Flowchart of the study participants.
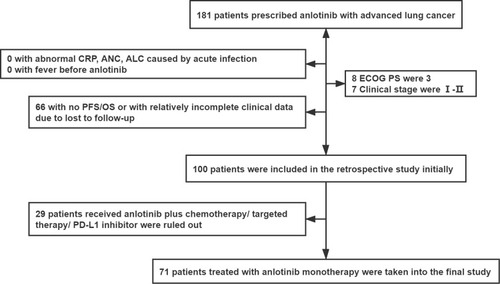
Table 2 Univariate Cox Regression Analyses of PFS and OS
Table 3 Multivariate Cox Regression Analysis of PFS and OS
Table 4 ORR, PFS and OS According to Median ANC
Figure 2 Progression-free survival (PFS) according to absolute neutrophil count (ANC). In the group with ANC ≥ 4.58, the median PFS (mPFS) is 7.0 months, and the 95% confidence interval (CI) is 4.4–9.6 months; In the group with ANC < 4.58, the mPFS is 5.0 months, and the 95% CI is 4.4–5.7 months. P value is 0.024.
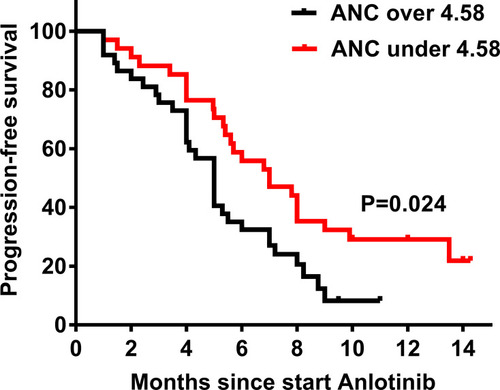
Figure 3 Overall survival (OS) according to ANC. In the group with ANC ≥ 4.58, the median OS (mOS) is 17.6 months, and the 95% CI is 12.3–22.9 months; In the group with ANC < 4.58, the mOS is 7.3 months, and the 95% CI is 4.7–10.0 months. P value is less than 0.001.
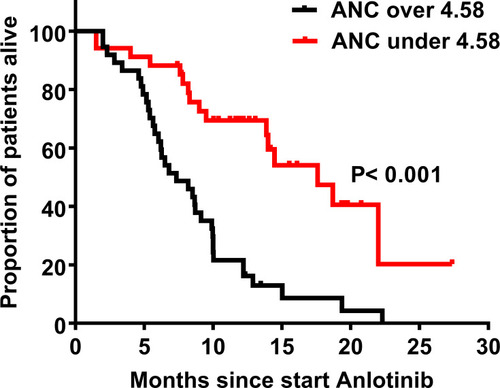
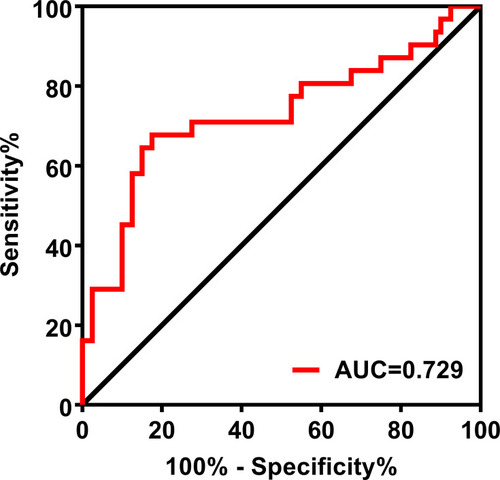
Figure 4 ROC curve of the ANC for predicting 10-month survival of patients with advanced lung cancer. The area under the curve (AUC) of the ROC curve was 0.729 The sensitivity and specificity were 82.5% and 67.7%, respectively.