Figures & data
Figure 1 Study design flowchart. A total of 302 patients with ameloblastoma with complete relevant information were enrolled in this study and then randomly separated into training and validation sets with a ratio of 7:3.
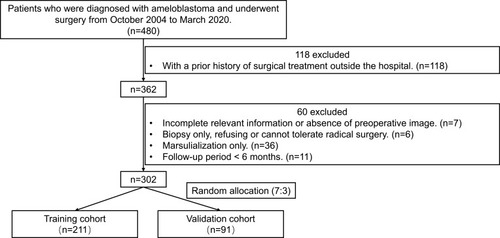
Table 1 Baseline Characteristics of Patients in the Training and Validation Sets
Figure 2 Kaplan-Meier RFS curves in the 302 ameloblastoma patients according to: (A) sex; (B) root(s) resorption; (C) cortical bone perforation; (D) radiographic features; (E) WHO classification; (F) treatment pattern. (p-value was calculated by univariate Cox analysis. (D) p1 means unilocular vs multilocular, p2 means others vs multilocular).
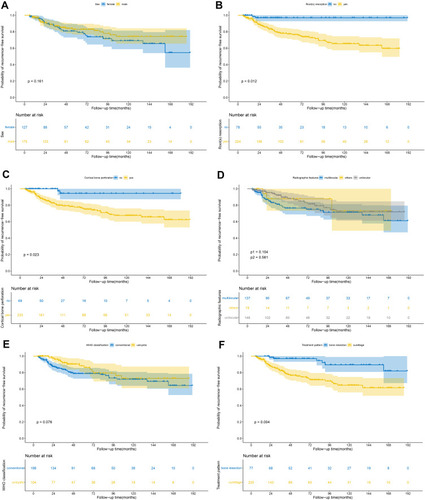
Table 2 Univariate and Multivariate Cox Regression Analyses of Clinicopathologic Factors with Recurrence-Free Survival in the Training Set
Figure 3 Nomogram of prediction for 3-, 5- and 10-year RFS in patients with ameloblastoma. Each factor was given a score, and the total score for an individual patient could be obtained by summing up all scores. The predictive probabilities of RFS at 3-years, 5-years and 10-years were identified by the total score according to the bottom scale.
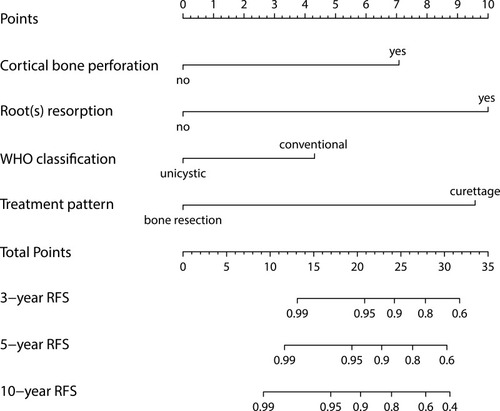
Figure 4 Calibration curves of the nomogram for predicting 3-, 5- and 10-year RFS in training set (A, C and E) and validation set (B, D and F). The dotted line represents the ideal match between the nomogram-predicted survival (X-axis) and actual survival (Y-axis). Vertical bars indicate 95% confidence intervals.
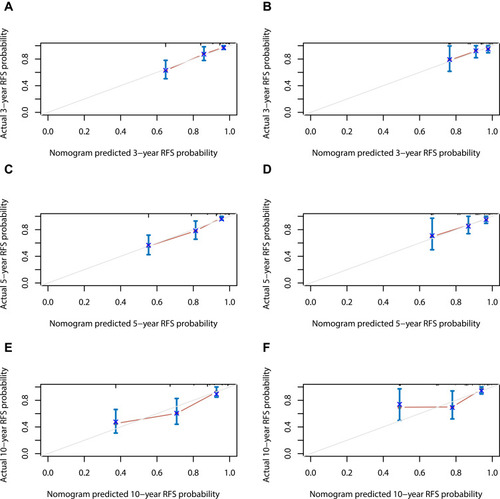
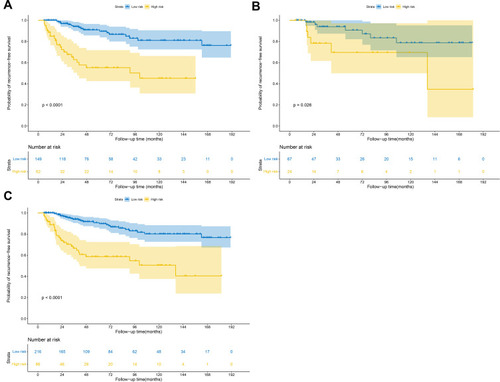
Figure 5 Kaplan-Meier RFS curves of low- and high-risk patients in the (A) training set, (B) validation set, and (C) all patients. (Log rank test).