
Figures & data
Figure 1 Treatment scheme and outline of the trial. The treatment scheme and timing of peripheral blood cell (PBC) assessments are shown in (A). The trial is summarized in (B).
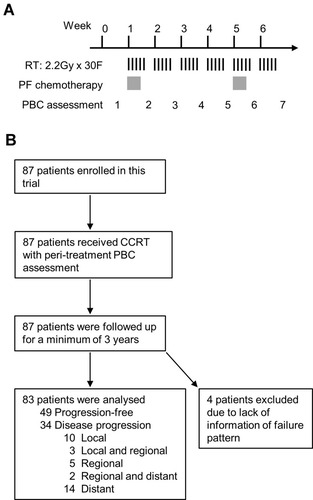
Figure 2 Distribution of peri-treatment peripheral blood cell parameters in patients with or without disease progression following definite chemoradiotherapy for esophageal squamous cell carcinoma. Eight peripheral blood cell parameters were collected from patients at seven time points during radiotherapy, including hemoglobin (A), neutrophils (B), platelets (C), lymphocytes (D), monocytes (E), neutrophil-to-lymphocyte ratio (NLR, F), platelet-to-lymphocyte ratio (PLR, G), and monocyte-to-lymphocyte ratio (MLR, H). These parameters in patients with (black, n = 34) or without (gray, n = 49) disease progression were plotted in parallel and compared. Values represent means with 95% confidence intervals Comparisons of means were performed using the two-tailed unpaired Student’s t-test (*P < 0.05).
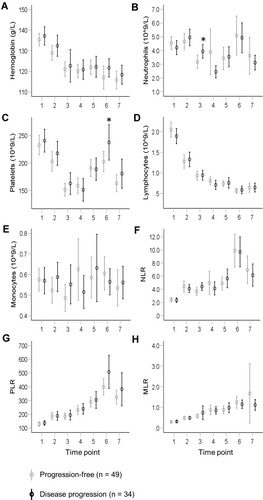
Figure 3 Discriminatory capacity of peri-treatment peripheral blood cell parameters for hazard of disease progression. The discriminatory capacity of peri-treatment peripheral blood cell parameters (PBC) for hazard of disease progression (A), and local (B), regional (C), and distant (D) progression, were evaluated individually by receiver operating characteristic (ROC) curves. Peri-treatment PBC parameters included hemoglobin, neutrophils, platelets, lymphocytes, monocytes, neutrophil-to-lymphocyte ratio (NLR), platelet-to-lymphocyte ratio (PLR), and monocyte-to-lymphocyte ratio (MLR). The areas under the curve (AUC) of these curves were summarized as a matrix with parameter type on the column and the time point on the row. AUCs with statistical significance are indicated by asterisks. AUC < 0.5, is not shown (*P < 0.05. **P < 0.01). The background of each AUC corresponds to its value, as indicated.
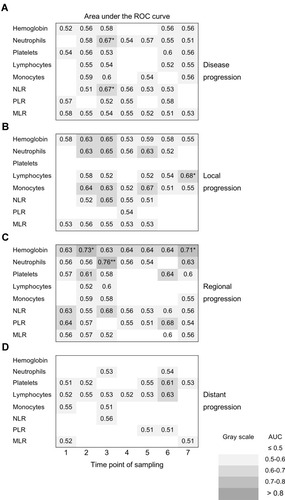
Figure 4 Development of peripheral blood cell score. Peri-treatment peripheral blood cell (PBC) parameters were ranked according to their area under the curve (AUC) for discrimination of local (A) and regional (B) progression using receiver operating characteristic (ROC) curves. The top 10 parameters are indicated. The values of each PBC parameter were normalized to the mean of the whole group (mean = 100). The mean of the top PBC (n = 2–10) parameters from (A) and (B) were calculated and designated as PBC scores for local and regional progression (PBCS-L and PBCS-R), respectively. The discriminatory capacity of PBCS-L and PBCS-R was evaluated using ROC curves and summarized in (C). The background of each AUC corresponds to its value, as indicated.
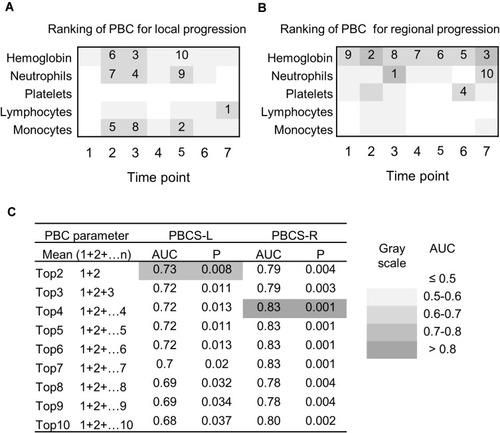
Figure 5 Peri-treatment peripheral blood cell score (PBCS) predicts long-term hazard of local or regional progression in esophageal cancer patients after chemoradiotherapy. The receiver operating characteristic curves of PBCS-L and PBCS-R are shown in (A) and (C), respectively. The cut-off value of the curve was determined using the Youden index. The percentage and 3-year cumulative hazard of local progression in patients with PBCS-L > 86 (black, n = 42) or PBCS-L ≤ 86 (gray, n = 41) are plotted in (B). The 3-year cumulative hazard of regional progression in patients with PBCS-R > 108 (black, n = 24) or PBCS-R ≤ 108 (gray, n = 59) is plotted in (D). Black pie charts indicate the percentage of patients with disease progression. A comparison of the 3-year cumulative hazards was performed using the Log rank test.
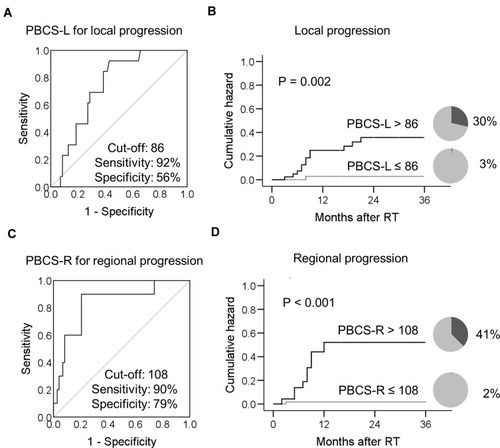
Table 1 Univariate and Multivariate Cox Regression Analysis for 3-Year Cumulative Hazard of Locoregional Tumor Progression
Figure 6 Peri-treatment peripheral blood cell score (PBCS) predicts long-term hazard of locoregional recurrence in patients with esophageal squamous cell carcinoma after chemoradiotherapy. Patients were divided into three subgroups according to their PBCS-L and PBCS-R. PBCS high (black solid line): PBCS-L and PBCS-R high; PBCS medium (black dashed line): either PBCS-L or PBCS-R high; PBCS low (gray solid line): both PBCS-L and PBCS-R low. The percentage and 3-year cumulative hazard of locoregional progression in patients categorized according to their PBCS is plotted in (A). The 3-year cumulative hazard of locoregional progression in patients categorized according to their clinical stage (II [black solid line] vs III [black dashed line] vs IV [gray solid line]) is plotted in (B). Black pie charts indicate the percentage of patients with disease progression. A comparison of the 3-year cumulative hazards was performed using the Log rank test.
![Figure 6 Peri-treatment peripheral blood cell score (PBCS) predicts long-term hazard of locoregional recurrence in patients with esophageal squamous cell carcinoma after chemoradiotherapy. Patients were divided into three subgroups according to their PBCS-L and PBCS-R. PBCS high (black solid line): PBCS-L and PBCS-R high; PBCS medium (black dashed line): either PBCS-L or PBCS-R high; PBCS low (gray solid line): both PBCS-L and PBCS-R low. The percentage and 3-year cumulative hazard of locoregional progression in patients categorized according to their PBCS is plotted in (A). The 3-year cumulative hazard of locoregional progression in patients categorized according to their clinical stage (II [black solid line] vs III [black dashed line] vs IV [gray solid line]) is plotted in (B). Black pie charts indicate the percentage of patients with disease progression. A comparison of the 3-year cumulative hazards was performed using the Log rank test.](/cms/asset/80ecb734-9d01-4288-b453-2b7ca92ae78f/dcmr_a_12189668_f0006_b.jpg)