Figures & data
Table 1 Baseline Characteristics of the Study Population Including Healthy Participants and Patients with Colorectal Adenomas and CRC in This Study
Figure 1 FFA levels in controls and CRC patients according to age (<35, 36–50, 51–65, and >66 years). The differences between groups (normal vs CA, normal vs CRC and CA vs CRC) were analysed by Student’s t test. One-way ANOVA was used to analyse significant differences among the normal, CA and CRC groups. The LSD-t test was used for post hoc comparisons of different age groups. *, <0.05; **, <0.01; ***, <0.001. A–D: FFA level differences between Normal, CA and CRC in groups of Age<35, Age36-50, Age 51-65, Age >66. E–G: FFA level differences from patients younger than age 35 to older than 66 in groups of Normal, CA and CRC.
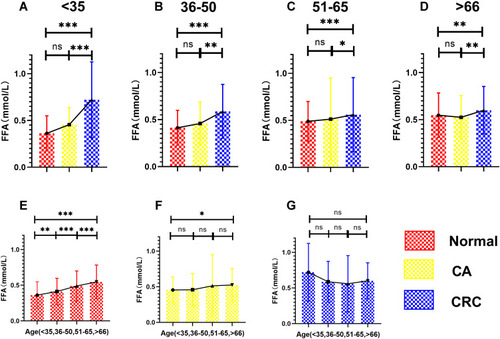
Table 2 The Values of FFA, CEA, and CA19-9 Alone and Combined Biomarkers for Distinguishing CRC Patients from Healthy Participants and Patients with Colorectal Adenomas from 21 to 88 Years Old
Figure 2 ROC curves of single and combined detection with FFA, CEA and CA19-9 in patients 21 to 88 years old. ROC curve analysis was used to evaluate the ability to distinguish patients with CRC from controls. Patients with CA and healthy participants were considered as controls.
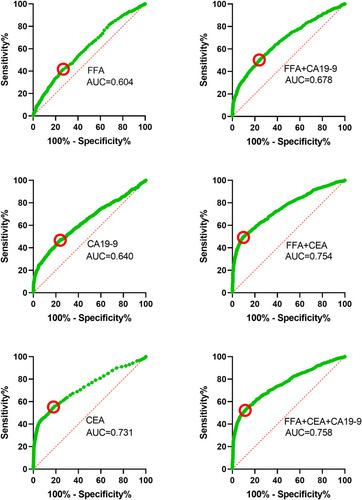
Table 3 The Values of FFA, CEA, and CA19-9 Alone and Combined Biomarkers for Distinguishing CRC Patients from Healthy Participants and Patients with Colorectal Adenomas Younger Than or Equal to 50 Years Old
Figure 3 ROC curves for single and combined detection with FFA, CEA and CA19-9 in patients younger than 50 years old. ROC curve analysis was used to evaluate the ability to distinguish patients with CRC from controls among those younger than 50 years. Patients with CA and healthy participants were considered as controls.
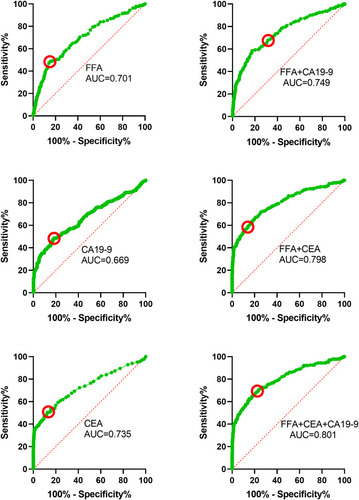
Table 4 Ability of Serological Biomarkers to Predict CRC in Patients Younger or Older Than 50 Years
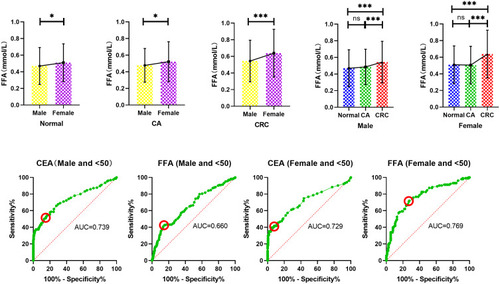
Figure 4 FFA levels in controls and CRC patients according to sex; ROC curves of FFA and CEA in patients younger than 50 years according to sex. The differences between groups (normal vs CA, normal vs CRC and CA vs CRC) were analysed by Student’s t test. The ROC curve of CEA and FFA was used to evaluate the ability to distinguish patients with CRC from controls among patients younger than 50 years. Patients with CA and healthy participants were considered as controls. *, <0.05; ***, <0.001.