Figures & data
Table 1 Clinicopathological Characteristics of 296 Patients with Esophageal Squamous Cell Carcinoma Receiving Surgery
Figure 1 Kaplan–Meier survival curves for progression-free survival (PFS) in patients with ESCC receiving surgery. (A) 1-, 3-, and 5-year PFS of patients with preoperative tumor volume <28 cm3 were longer than those with 28–64 cm3 group or >64 cm3 group. (P< 0.001, log-rank). (B) 1-, 3-, and 5-year PFS of patients with preoperative tumor length <3 cm were obvious different from those with 3–5 cm group or >5 cm group. (P < 0.001, log-rank). (C) 1-, 3-, and 5-year PFS of patients with preoperative maximum diameter <2.5 cm group were obviously improved compared with patients of 2.5–3.5 cm group or >3.5 cm group. (P < 0.001, log-rank). (D) 1-, 3-, and 5-year PFS of patients with non-regional lymph node metastasis group were longer than those with oligo or multiple-regional lymph node metastasis group. (P< 0.001, log-rank).
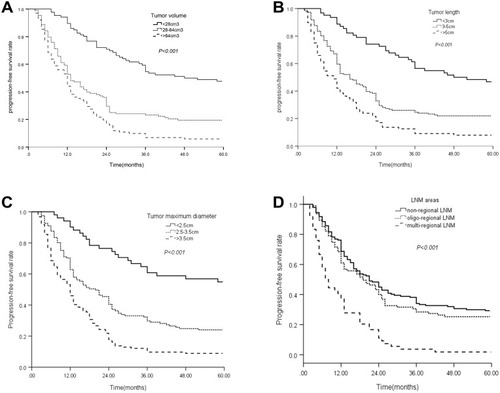
Figure 2 Kaplan–Meier survival curves for overall survival (OS) in patients with ESCC after surgery. (A) 1-, 3-, and 5-year OS of patients with preoperative tumor volume <32 cm3 were longer than those with 32–72 cm3 group or >72 cm3 group. (P< 0.001, log-rank). (B) 1-, 3-, and 5-year OS of patients with preoperative tumor length <3 cm were obvious different from those with 3–5 cm group or >5 cm group. (P < 0.001, log-rank). (C) 1-, 3-, and 5-year OS of patients with preoperative maximum diameter <2.5 cm group were obviously improved compared with patients of 2.5–3.5 cm group or >3.5 cm group. (P < 0.001, log-rank). (D) 1-, 3-, and 5-year OS of patients with non-regional lymph node metastasis group were longer than those with oligo or multiple-regional lymph node metastasis group. (P< 0.001, log-rank).
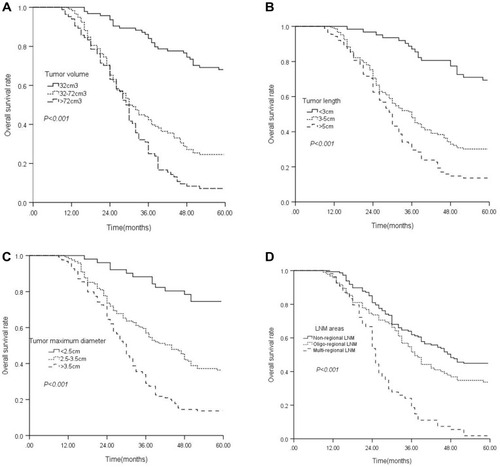
Table 2 Univariate and Multivariate Analysis for PFS in 296 Esophageal Squamous Cell Carcinoma Treated by Surgery
Table 3 Univariate and Multivariate Analysis for OS in 296 Esophageal Squamous Cell Carcinoma Followed by Surgery
Figure 3 ROC curve for survival prediction. (A) ROC curves of preoperative tumor volume and the number of postoperative pathologically LNM regions for predicting PFS. (B) ROC curves of preoperative tumor volume and the number of postoperative pathologically LNM regions for predicting OS.
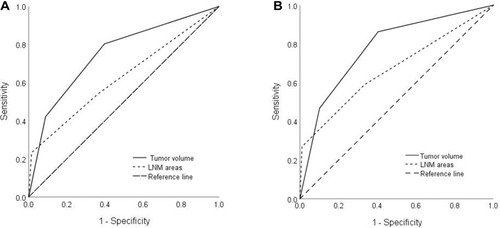
Figure 4 Prediction Nomogram for PFS. (A) The model that incorporated differentiation grade, TNM stage, adjuvant therapy, preoperative tumor volume and the number of postoperative pathologically LNM regions was developed and presented as the nomogram; (B) The calibration curve of the nomogram for the 5-year PFS; (C) The decision curve analysis of the nomogram for the PFS.
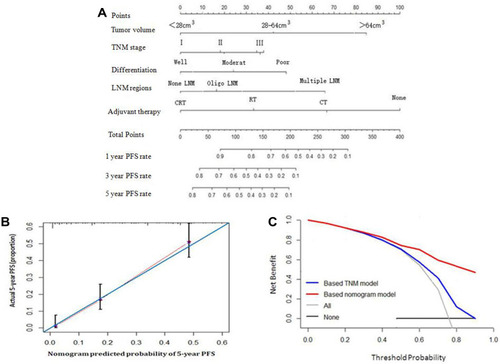
Figure 5 Prediction Nomogram for OS. (A) The model that integrated all significant independent factors for OS was shown as the nomogram; (B) The calibration curve of the nomogram for the 5-year OS; (C) The decision curve analysis of the nomogram for the OS.
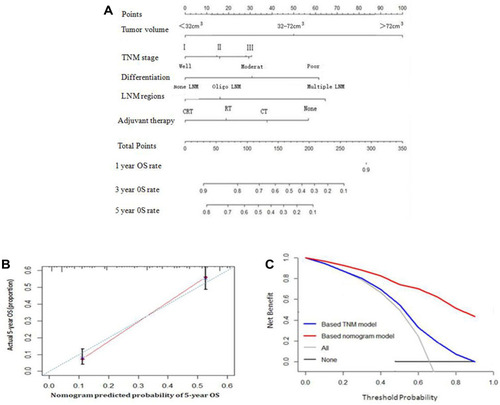
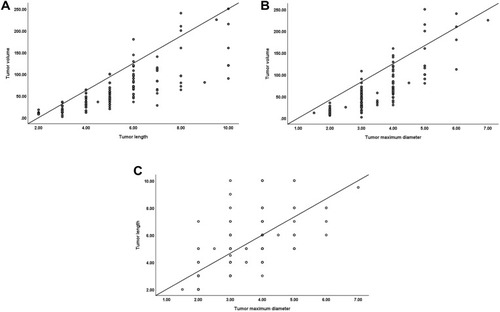
Figure 6 Correlations among preoperative tumor volume, length, and maximum diameter. (A) Correlation chart between preoperative tumor volume and length (regression line: Y=−39.458+19.612×X, correlation coefficient: R2 =0.655, P<0.001). (B) Correlation chart between preoperative tumor volume and maximum diameter (regression line: Y= −66.700+37.334×X, correlation coefficient: R2 =0.684, P<0.001). (C) Correlation chart between preoperative tumor length and maximum diameter (regression line: Y= 0.697+1.236×X, correlation coefficient: R2 =0.440, P<0.001).