Figures & data
Table 1 The Baseline Characteristics Between EBS and PTBD in Patients with Bismuth Types III–IV
Table 2 Efficacy and Safety Comparison Between EBS and PTBD in Patients with Bismuth Types III–IV
Table 3 Comparison of the Baseline Characteristics Between Patients Who Underwent Bilateral and Unilateral Stenting
Table 4 Efficacy and Safety Comparison Between Unilateral and Bilateral Stenting
Table 5 The Clinical Success Rates in Unilateral and Bilateral Groups with Bismuth II-IV Scores
Figure 1 Survival time curve obtained by Kaplan-Meier analysis shows no difference between EBS and PTBD (P = 0.057).
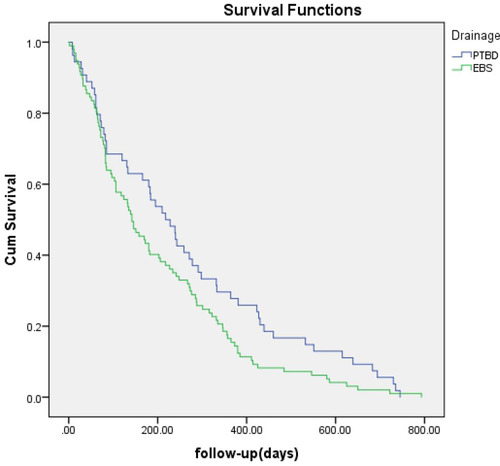
Figure 2 Survival time curve obtained by Kaplan-Meier analysis shows no difference between unilateral and bilateral drainage (P = 0.371).
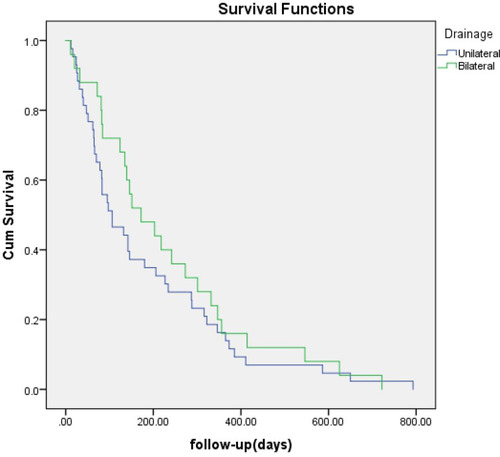
Figure 3 Kaplan-Meier analysis of survival between patients with or without clinical success. Cumulative survival rates were significantly higher in patients with CS (green line) (P = 0.000).
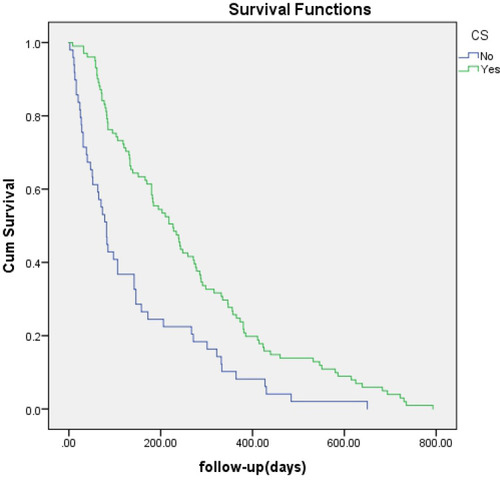
Figure 4 Kaplan-Meier analysis of survival between patients with TNM I–II and those with TNM III–IV. Cumulative survival rates were significantly higher in patients with TNM I-II (blue line) (P = 0.012).
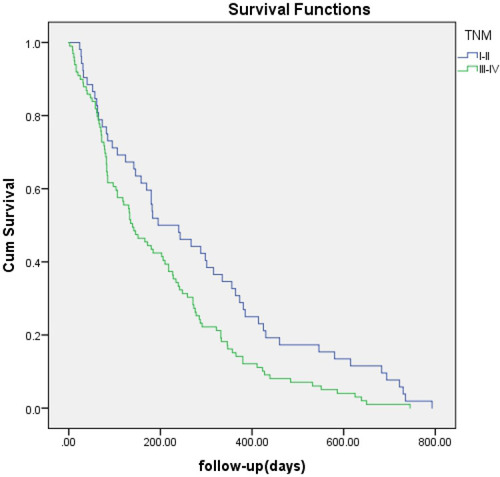
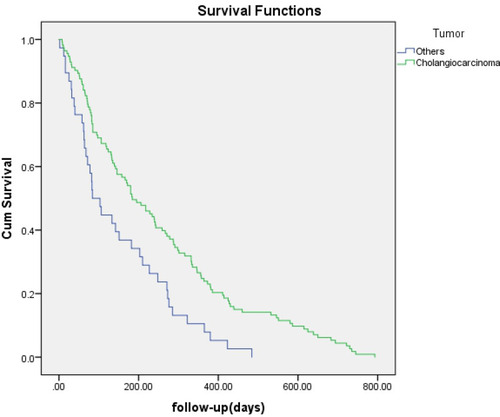
Figure 5 Kaplan-Meier analysis of survival between patients with cholangiocarcinoma and those with other tumors. Cumulative survival rates were significantly higher in patients with cholangiocarcinoma (green line) (P = 0.001).