Figures & data
Figure 1 Identification of DEGs in HCC samples: The TCGA expression profile comparison between low-Myc expression and high-Myc expression groups: (A) The volcano diagrams show the DE lncRNAs, miRNAs, and mRNAs in low-Myc expression and high-Myc expression groups, respectively. The blue dots indicate the downregulated DE-RNAs; The red dots indicate the up-regulated DE-RNAs. (B) The heat map of all target values of DE lncRNAs, miRNAs, and mRNAs from liver tissues of low-Myc expression and high-Myc expression samples.
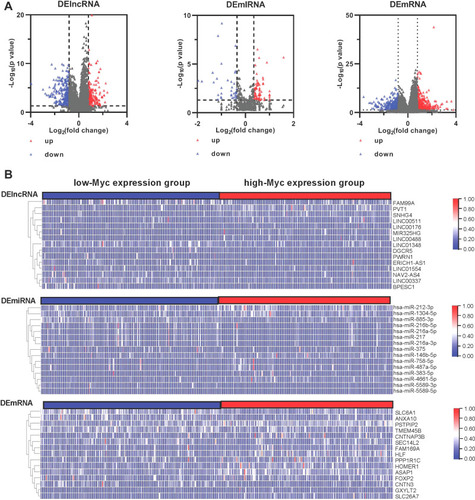
Figure 2 A hub triple regulatory network and functional enrichment in HCC: The lncRNA-miRNA-mRNA triple relationship network in HCC samples: (A) The blue rhombus represented down-regulated lncRNAs, red rhombus represented up-regulated lncRNAs. The blue triangles represented down-regulated miRNAs, red triangles represented up-regulated miRNAs. The blue ellipses represented down-regulated mRNAs, red ellipses represented up-regulated mRNAs. (B) A Myc-associated hub triple regulatory network through cytoHubba analysis based on the above regulatory network. (C) Gene ontology and KEGG pathway analysis of DE-mRNAs.
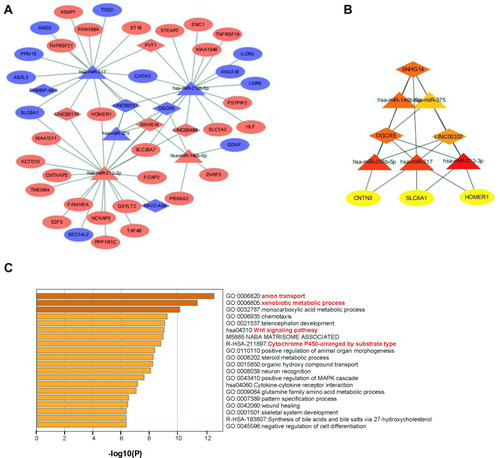
Figure 3 Identification of potential miRNA-mRNA pairs in the setting of Myc: (A) Constructed a significant miRNA-mRNA pair in HCC: blue=down- regulated, red =up-regulated. (B) The TargetScan predicted website, the target combination site between the SLC6A1 3ʹUTR and miR-212-3p/miR-217, was shown, respectively. (C) The correlation analysis between Myc and miR-212-3p/SLC6A1 axis expression in HCC tissues from TCGA data. (D-E). The expression distribution of SLC6A1 in 365 HCC tissues, compared with 50 adjacent normal liver tissues from the TCGA databases. (F) Expression of SLC6A1 in HCC and normal tissue samples from the TCGA and GTEx databases. (G) Kaplan–Meier analysis of HCC according to SLC6A1 expression.
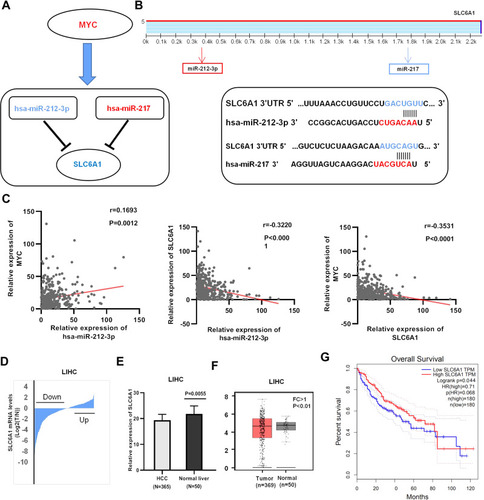
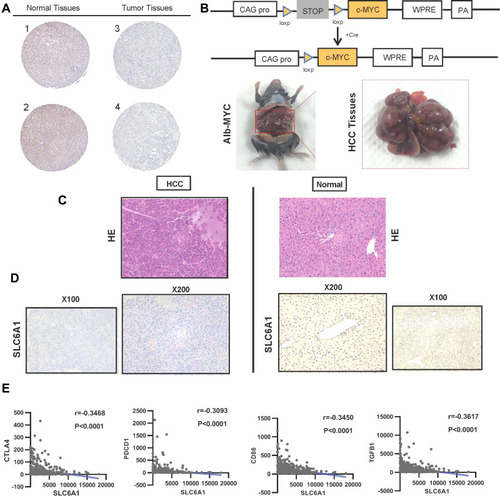
Figure 4 The protein level and immune checkpoint analysis of SLC6A1 in HCC: (A) Immunohistochemistry analysis shows the expression of SLC6A1 on protein by the Human Protein Atlas database. (B) The intercrossing of Myc and Alb-Cre mice through Cre/loxP transgenic technology (C) The Inspection of cell morphology changes in Alb-Cre/Myc mouse HCC tissues and WT mouse normal tissues through HE staining. (D) Immunohistochemistry analysis compared the expression of SLC6A1 on protein level in Alb-Cre/Myc mouse HCC tissues and WT mouse normal tissues. (E) The closely negative correlations between SLC6A1 and T cell exhaustion (CTLA-4, PD-L1)/Monocyte (CD86) in liver cancer tissues.