Figures & data
Figure 1 Detection of different subtypes of CTCs and CTECs expressing CD44 and vimentin in PDAC patients by SE-iFISH. (A) A CTC (DAPI+/CD45-/CD31-/vimentin-/CEP8+) has a positive expression of CD44; A CTC cluster (DAPI+/CD45-/CD31-/vimentin-/CEP8+) has a positive expression of CD44; A CTC (DAPI+/CD45-/CD31-/vimentin-/CEP8+) has a negative expression of CD44; A CTC cluster (DAPI+/CD45-/CD31-/vimentin+/CEP8+) has a negative expression of CD44. (B) A CTEC (DAPI+/CD45-/CD31+/vimentin-/CEP8+) has a positive expression of CD44; A CTEC cluster (DAPI+/CD45-/CD31+/vimentin+/CEP8+) has a positive expression of CD44; A CTEC (DAPI+/CD45-/CD31+/vimentin-/CEP8+) has a negative expression of CD44; A CTEC cluster (DAPI+/CD45-/CD31+/vimentin+/CEP8+) has a negative expression of CD44.
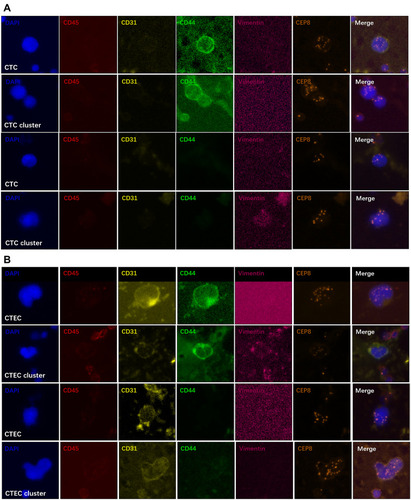
Table 1 Demographic Characteristics, Surgical Details and Pathological Details
Figure 2 Flow diagram of patient enrollment.
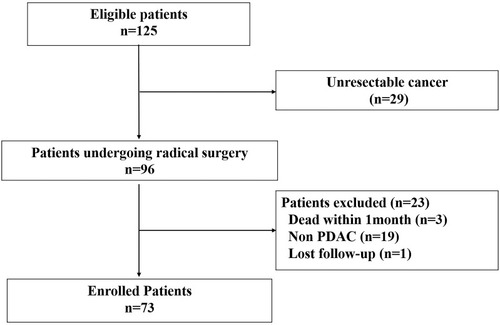
Table 2 CTCs and CTECs Details
Figure 3 The dynamics of (A) CA 19–9 levels, numbers of (B) CTCs, (C) CD44+ CTC, (D) vimentin+ CTC, (E) CTCM, and numbers of (F) CTECs (G) CD44+ CTEC, (H) vimentin+ CTEC, (I) CTEM in different phases (preoperative, POD7 and POM1). The patients were divided into early recurrence (ER) group (DFS<6 months) and late recurrence (LR) group (DFS≥6 months) according to the DFS.
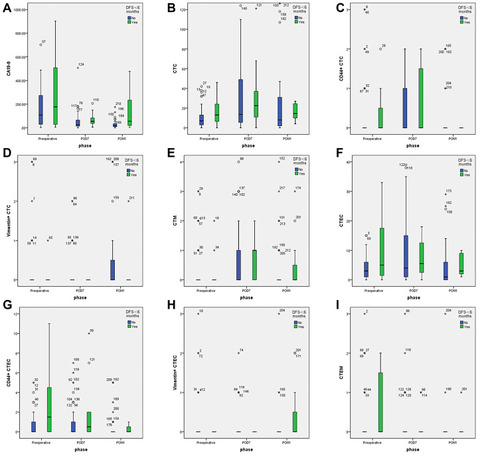
Table 3 Univariate and Multivariate Cox Regression Analyses of Prognosis Factors (Clinicopathological Factors) for Disease Free Survival
Table 4 Univariate and Multivariate Cox Regression Analyses of Prognosis Factors (CA19-9, CTCs and CTECs) for Disease Free Survival
Table 5 Univariate and Multivariate Cox Regression Analyses of Prognosis Factors (Clinicopathological Factors) for Overall Survival
Table 6 Univariate and Multivariate Cox Regression Analyses of Prognosis Factors (CA19-9, CTCs and CTECs) for Overall Survival
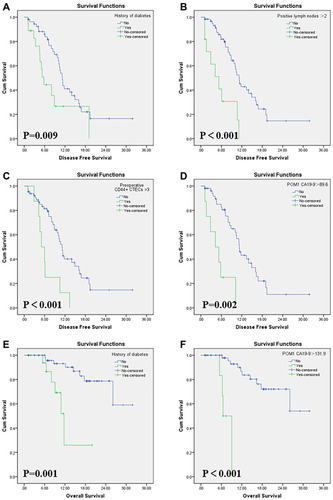
Figure 4 The DFS were significantly different between two comparative groups divided by the independent prognostic factors: (A) history of diabetes, (B) positive lymph nodes > 2, (C) preoperative CD44+ CTECs > 3, (D) POM1 CA19-9 > 89.6 U/mL. The OS showed significantly different between two comparative groups divided by (E) history of diabetes, (F) POM1 CA19-9 > 131.9U/mL.