Figures & data
Figure 1 A 55-year-old man with LARC. (A) The maximum tumor area (MTA, pink curved line) on oblique axial HR-T2WI. (B) The maximum tumor length (MTL, pink straight line) and the distance from tumor to anal verge (DTA, white curved line) on sagittal T2WI. (C) The maximum tumor thickness (MTT, pink straight line) on oblique axial HR-T2WI.
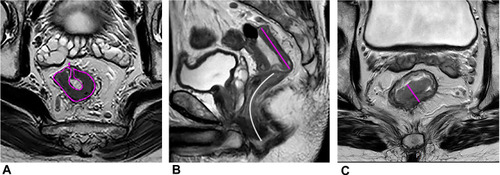
Figure 2 A 62-year-old woman with LARC. The oblique coronal T2WI (A) and DWI (b=1000 s/mm2) (B) show primary rectal cancer before therapy (white arrow). Six weeks after the end of NAT, uneven thickening of the intestinal wall was still shown with intermediate signal intensity in oblique coronal T2WI (C) and hyperintensity signal intensity in DWI (b=1000 s/mm2) (D), which mimic residual tumor (white arrow). Six days later, the patient underwent total mesorectal excision (TME), and the surgical resection specimen achieved pCR.
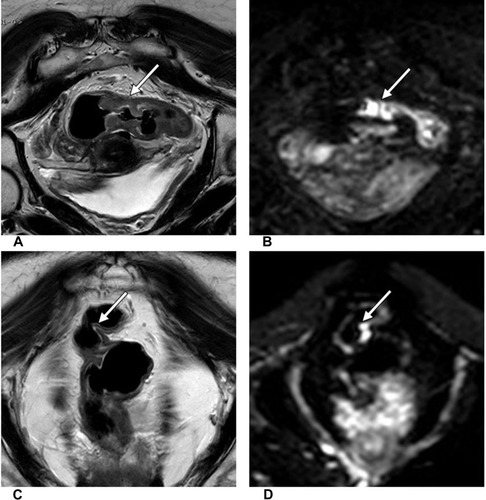
Figure 3 A 55-year-old man with LARC who achieved pCR after therapy. The oblique axial HR-T2WI (A and D), oblique axial DWI (b = 1000 s/mm2) (B and E), oblique axial ADC map (C and F) show the images of LARC before (A–C) and after (D–F) NAT. The mean ADC values were 0.87×10⁻³ mm2/s (C), 1.11×10⁻³mm2/s (F) respectively.
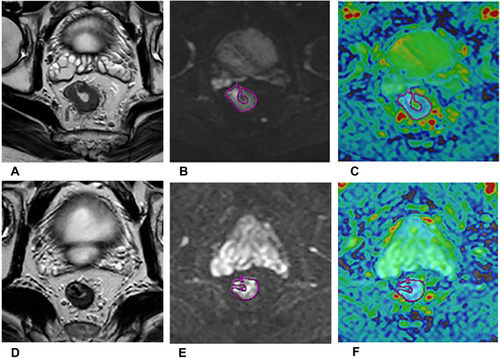
Figure 4 A 55-year-old man with LARC who achieved pCR after therapy. IVIM parameters derived from DWI before (A–C) and after (D–F) NAT. (A and D) Oblique axial D map; (B and E) oblique axial D* map; (C and F) oblique axial f map.
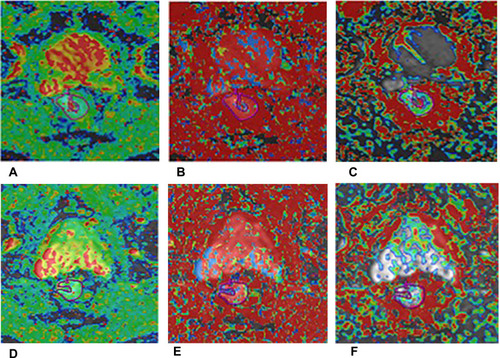
Figure 5 A 55-year-old man with LARC who achieved pCR after therapy. DKI parameters derived from DWI before (A and B) and after (C and D) NAT. (A and C) Oblique axial D map; (B and D) oblique axial K map.
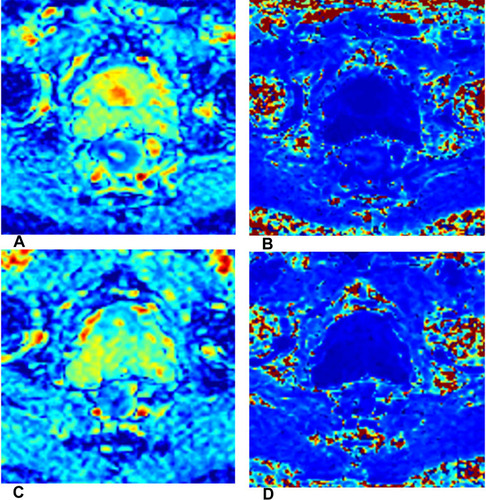
Figure 6 A 61-year-old man with LARC who achieved pCR after therapy. Dynamic Contrast-Enhanced MRI before (A–C) and after (D–F) neoadjuvant chemoradiation therapy for locally advanced rectal cancer which achieved pathological complete response. (A and D) Oblique axial Ktrans map; (B and E) oblique axial Kep map; (C and F) oblique axial Ve map.
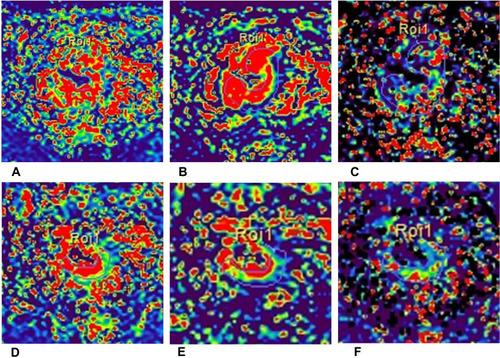
Table 1 Summary of Statistically Significant MR Parameters in Predicting and Evaluating Complete Tumor Response of Rectal Cancer After NAT
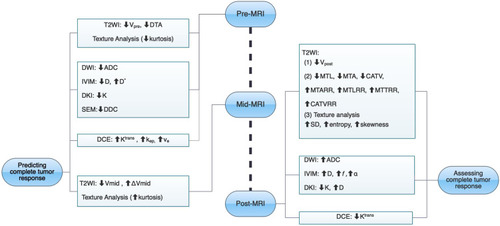
Figure 7 The summary chart of multiple MRI methods for predicting and assessing complete tumor response after neoadjuvant therapy in locally advanced rectal cancer.