Figures & data
Table 1 Classification of PD-L1 Protein Expression Level in LUSC
Figure 1 PD-L1 protein expression and gene amplification in lung squamous cell carcinoma. (A and B) Representative images of PD-L1 protein expression. (A) Low to moderate expression of PD-L1 (1%≤TPS≤49%) × 400. (B) High expression of PD-L1 protein (TPS> 50%) × 400. (C and D) Representative images of PD-L1 gene amplification analysed by FISH. (C) PD-L1 gene amplified Ratio > 2, parts of PD-L1 gene (red fluorescence) were expressed in clusters ×1000. (D) PD-L1 gene without amplification×1000.
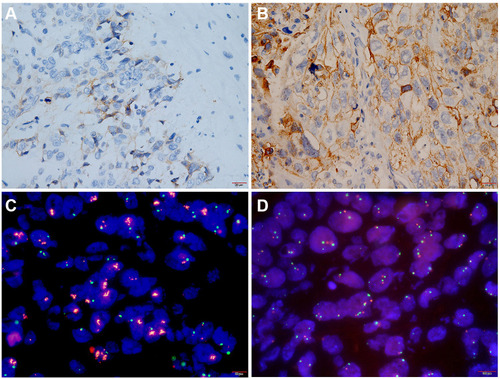
Table 2 Relationship Between PD-L1 Gene Amplification and Clinicopathological Features of Lung Squamous Cell Carcinoma
Table 3 Correlation Between PD-L1 Gene Amplification and Protein Expression
Table 4 Univariate Prognostic Factor Analysis by Log Rank Test
Table 5 Cox Multivariate Survival Analysis in LSUC Patents
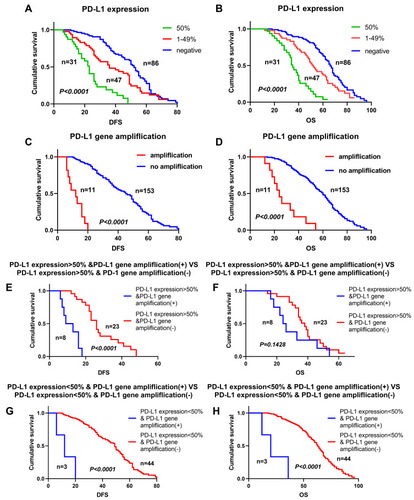
Figure 2 Kaplan-Meier survival curves of PD-L1 amplification and expression in patients with lung squamous cell carcinoma. (A and C) DFS curve of patients with lung squamous cell carcinoma. (B and D) OS curve of patients with lung squamous cell carcinoma. (E) DFS curve of PD-L1 expression >50% and gene amplification. (F) OS curve of PD-L1 expression >50% and gene amplification. (G) DFS curve of PD-L1 expression<50% and gene amplification. (H) OS curve of PD-L1 expression <50% and gene amplification.