Figures & data
Figure 1 The efficacy of atezolizumab versus standard therapy in terms of liver metastasis (LM). Forest plots of hazard ratios (HRs) with 95% confidence intervals (CIs) for (A) progression-free survival (PFS) and (B) overall survival (OS) in pan-cancer across treatment lines, comparing atezolizumab and standard therapy in patients with and without LM respectively. Kaplan-Meier estimates of OS with atezolizumab versus docetaxel in (C) LM population and (D) non-LM population in an individual non-small cell lung cancer cohort.
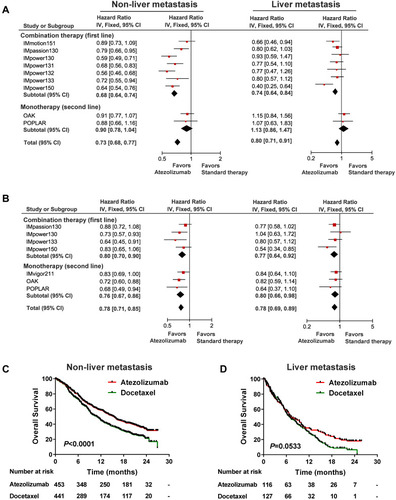
Table 1 Biomarker Screening by Calculating Hazard Ratio of Atezolizumab versus Docetaxel with 95% Confidence Interval (CI) and Corresponding P-value for Each Clinical Characteristic in the Liver Metastatic Population from the OAK Cohort
Figure 2 Impact of PD-L1 strong expression on efficacy of atezolizumab versus chemotherapy regarding liver metastasis (LM). Kaplan-Meier estimates of overall survival (OS) comparing atezolizumab and docetaxel in (A) all LM patients, (B) LM patients with a PD-L1 expression level of TC3 or IC3, (C) LM patients with a PD-L1 expression level of TC 0/1/2 or IC0/1/2, (D) all non-LM patients, (E) non-LM patients with TC3 or IC3, and (F) non-LM patients with TC0/1/2 or IC0/1/2.
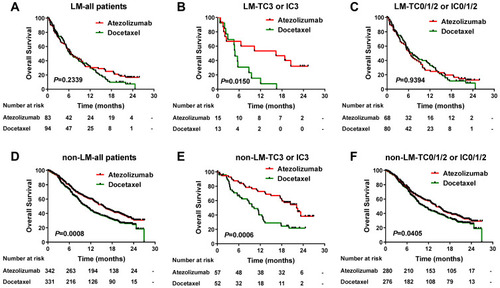
Figure 3 Combination of PD-L1 expression and liver metastasis (LM) for risk stratification of patients received atezolizumab. Kaplan-Meier estimates of overall survival (OS) stratified by LM status in (A) the OAK cohort and (B) the IMvigor210 cohort. Kaplan-Meier estimates of OS stratified by LM status and PD-L1 expression level in (C) the OAK cohort and (D) the IMvigor210 cohort.
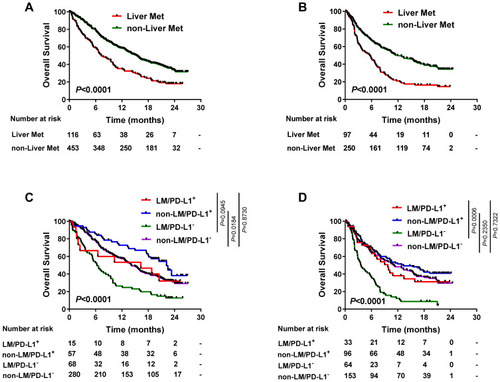
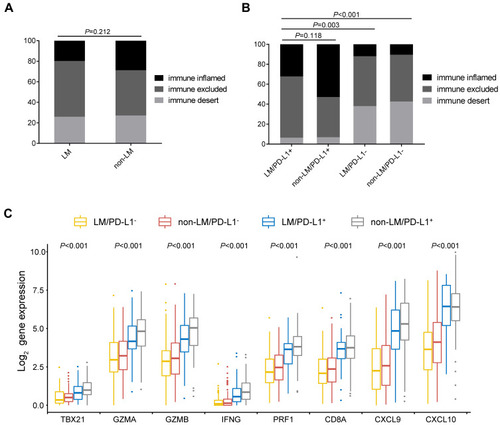
Figure 4 Association of PD-L1 strong expression and liver metastasis (LM) with immune profiles. Immune phenotype distributions by (A) liver metastatic status and (B) combination of liver metastatic status and PD-L1 strong expression status. (C) T-effector gene expression as a function of PD-L1 strong expression and liver metastatic status.