Figures & data
Figure 1 Weighted gene co-expression network in glioma. (A) Hierarchical clustering dendrogram of genes based on co-expression network analysis. Each piece of the leaves (short vertical lines) corresponds to individual gene. The branches correspond to modules of highly interconnected genes. Different colors below the dendrograms represent different gene modules. (B) Dendrogram of consensus module eigengenes. (C) The correlation coefficient heatmap of the co-expression module genes. Each bright spot corresponds to the correlation between each gene and other genes. The deeper the colors, the stronger is the connectivity between the two genes in the corresponding row and column. (D) Correlation between the gene module and clinical traits. The clinical traits include different WHO grades of glioma. The correlation coefficient in each cell represented the correlation between the gene module and the clinical traits, which decreased in size from red to blue. The corresponding P value is also annotated.
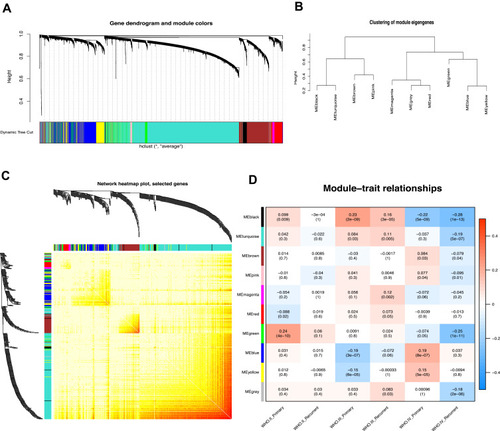
Figure 2 Functional Enrichment analysis of genes in blue (A) and yellow (B) modules. Different color displayed distinct GO terms. Statistical significance was derived by two-sided tests.
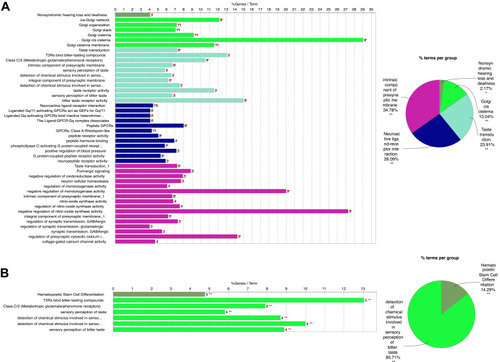
Figure 3 Module visualisation and Identification of hub genes. Visualisation of the gene co-expression network of the blue (A) and yellow modules (B) were generated using Cytoscape. Top 10 hub genes in blue (C) and yellow (D) modules were calculated by cytoHubba ranked by degree. The darkness of red in nodes represents the depth of degree.
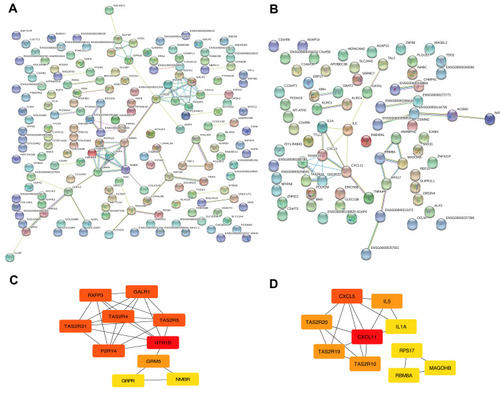
Figure 4 Expressions patterns about different grades and progression status of CXCL5 (A) and CXCL11 (B) in CGGA. Expression levels of CXCL5 (A) and CXCL11 (B) among normal, GBM and LGG samples. as well as in different molecular subtypes of GBM. P-value was tested by t-test. Immunohistochemical analyses of CXCL5 (C) and CXCL11 (D) protein expression levels in normal brain tissues (cerebral cortex) and glioma cancer specimens. Images were obtained from the HPA resource.
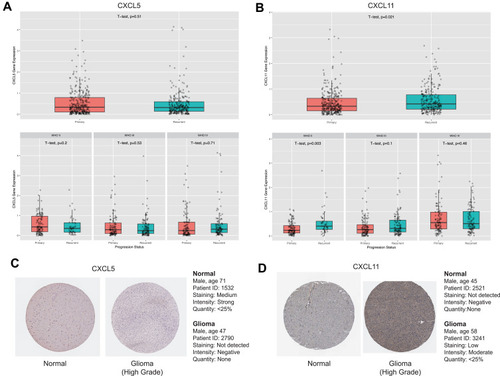
Figure 5 Survival curves between groups with low and high GRPR (A), CXCL5 (B), and CXCL11 (C) expressions in TCGA. The red and green lines represent cases with high and low expressions, separately. The X axis indicates survival time (months) and the Y axis indicates the present survival (%).
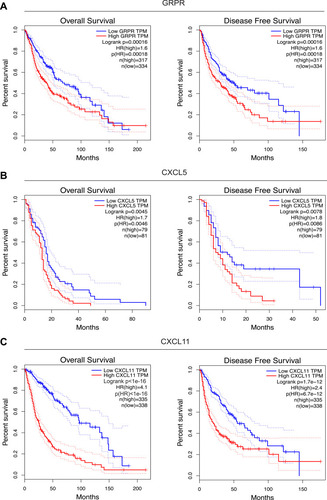
Figure 6 Correlation of CXCL5 (A), CXCL11 (B), and GRPR (C) expressions with immune infiltration level in GBM. (D) Corrplot map of three DEGs and immune checkpoint markers in TCGA-GBM database.
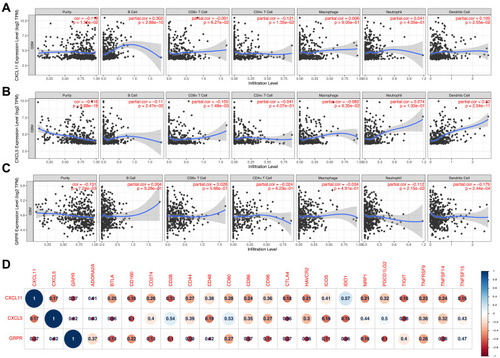
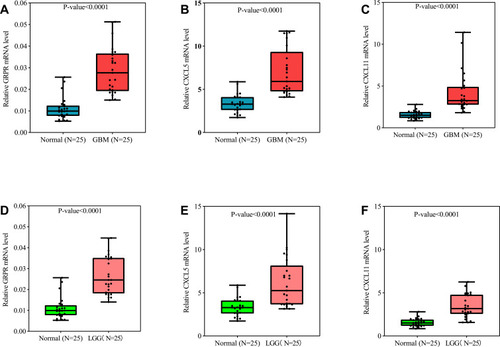
Figure 7 GRPR (A), CXCL5 (B), and CXCL11 (C) expression levels correlated in glioma tissue. qRT-PCR analysis of GRPR (A and D), CXCL5 (B and E), and CXCL11 (C and F) in GBM (n=25), LGG (n=25), and control brain tissues (n=25). P-value was tested by t-test.