Figures & data
Figure 1 HSPA4 is highly expressed in CRC. (A and B) Expression levels of HSPA4 in CRC tumor tissues and adjacent normal tissues were detected by qRT-PCR (A) and IHC staining (B). (C) Kaplan-Meier survival analysis of HSPA4 expression and overall survival in CRC patients. Data are presented as mean ± SD (n = 3) of three triplicates or independent experiments.
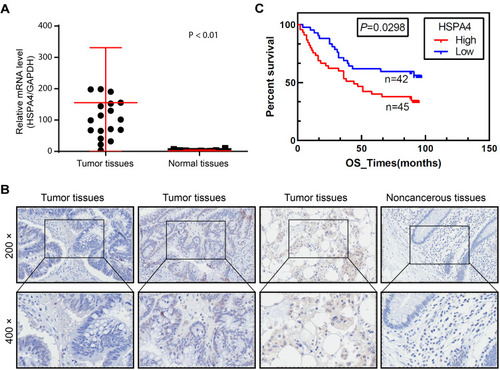
Table 1 Expression Patterns in Colorectal Cancer Tissues and Para-Carcinoma Tissues Revealed in Immunohistochemistry Analysis
Table 2 Relationship Between HSPA4 Expression and Tumor Characteristics in Patients with Colorectal Cancer
Table 3 The Correlation Between HSPA4 Expression and Multivariate Cox Regression
Figure 2 Knockdown of HSPA4 inhibits cell proliferation and promotes apoptosis in CRC cells. (A) Cell proliferation of HCT116 and RKO cells with or without knockdown of HSPA4 was evaluated in Celigo cell counting assays. Flow cytometry analysis based on Annexin V-APC staining was utilized to detect cell apoptotic ratio (B) and cell cycle distribution (C) for HCT116 and RKO cells. Data are presented as the mean ± SD (n = 3) of three triplicates or independent experiments. **P<0.01, ***P<0.001.
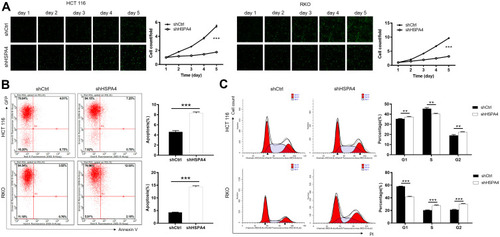
Figure 3 Knockdown of HSPA4 inhibits cell migration in CRC cells. (A and B) Cell migration of HCT116 and RKO cells with or without knockdown of HSPA4 was evaluated in wound healing assay (A) and Transwell assay (B). Data are presented as the mean ± SD (n = 3) of three triplicates or independent experiments. **P<0.01, ***P<0.001.
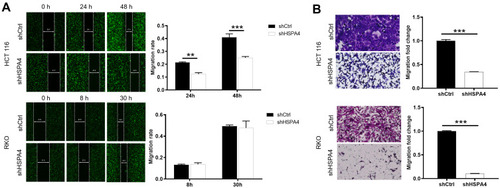
Figure 4 Knockdown of HSPA4 inhibits tumor growth in mice xenograft models. (A) The total bioluminescent intensity of tumors in shCtrl and shHSPA4 RKO cell groups. (B) Tumor volume measurements comparing shCtrl and shHSPA4 RKO cell groups. (C) Average tumor weights in shCtrl and shHSPA4 RKO cell groups. Images of mice and tumors in shCtrl and shHSPA4 groups. (D) Ki67 staining of tumor tissues in shCtrl and shHSPA4 groups. (A–C) data represent the mean ± SD of ten mice with 3 representative images shown. *P<0.05, ***P<0.001.
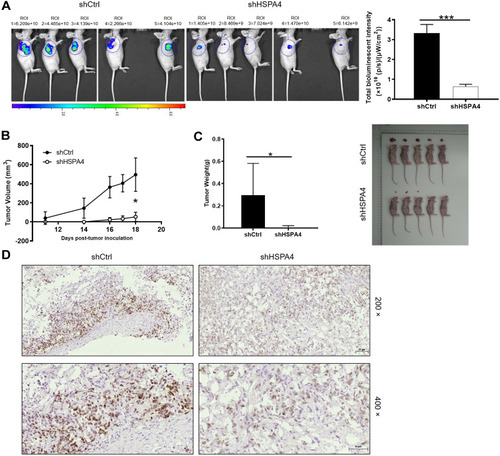
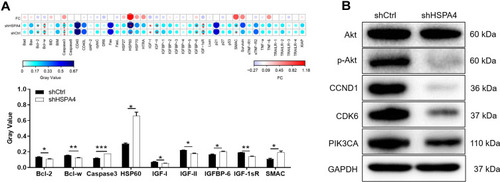
Figure 5 Exploration of molecular mechanisms downstream of HSPA4. (A) Human apoptosis antibody array analysis was performed in RKO cells with or without HSPA4 knockdown. (B) Western blotting analysis of the indicated signaling proteins in RKO cells with or without HSPA4 knockdown. Data are presented as the mean ± SD (n = 3) of three triplicates or independent experiments. *P<0.05, **P<0.01, ***P<0.001.