
Figures & data
Table 1 Baseline Characteristics of Patients with GBC According to PDW Levels
Figure 1 Optimal cut-off value for the PDW was identified by ROC curve analysis.
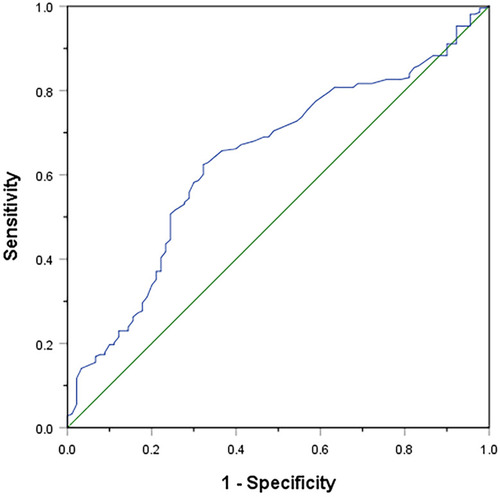
Figure 2 Kaplan–Meier overall survival curves of patients with GBC. (A) Overall survival of 303 patients with GBC. (B) comparing survival outcomes between the PDW≤14.95 group and PDW>14.95 group.

Table 2 Univariate and Multivariate Analysis of Overall Survival in Patients with GBC