Figures & data
Table 1 Biological Radiation Parameters of ESCC Cells in the Different Groups
Figure 1 (A) The knockdown efficiency of the three UHRF1 shRNAs was confirmed by quantitative real-time polymerase chain reaction, qRT-PCR. (B) The knockdown efficiency of UHRF1 shRNA was confirmed by Western blot analysis in ECA109 and TE-1 cells. GAPDH was used for normalization (**P < 0.01 vs NC group).
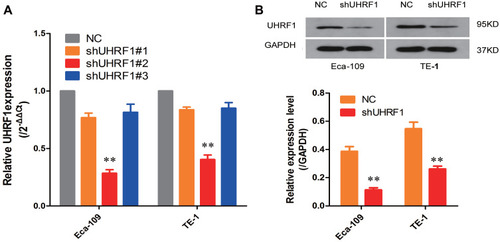
Figure 2 UHRF1 knockdown sensitized ESCC cells to irradiation in vitro and in vivo. (A) Clonogenic survival assays were performed to measure radiosensitivity in Eca109 and TE-1 cells. (B) Survival curves in NC and shUHRF1 cells treated with irradiation are shown. (C) Tumor volumes of xenograft mouse tumors. (D) Tumor weight of xenograft mouse tumors. (E) Representative data of tumors in nude mice bearing Eca109 cells (*P < 0.05, **P < 0.01 vs NC group).
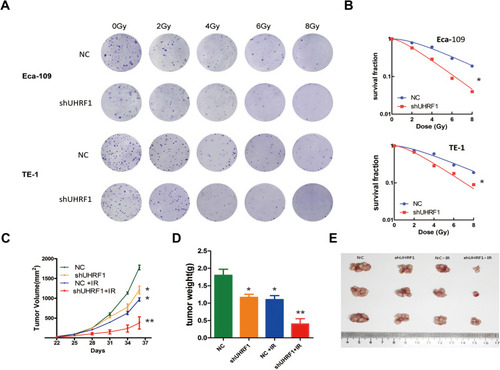
Figure 3 Knockdown of UHRF1 induced apoptosis in ESCC cells before and after 6 Gy irradiation. (A) Apoptotic changes in ESCC cells in different groups were examined with FCM. (B) Western blot analysis of apoptosis-related markers in ESCC cells in different groups (*P < 0.05, **P < 0.01 vs NC group).
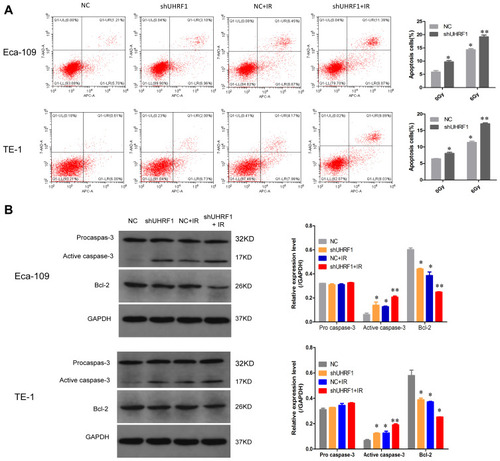
Figure 4 The effect of UHRF1 knockdown on the expression of key proteins in the PI3K/Akt/mTOR signaling pathway in ESCC cells before and after 6 Gy irradiation (*P < 0.05, **P < 0.01 vs NC group).
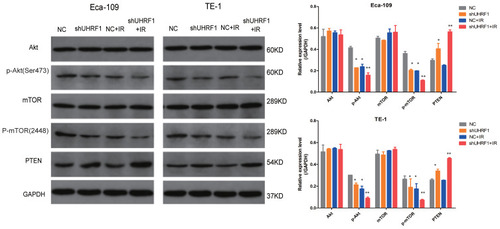
Figure 5 The effect of UHRF1 overexpression on the expression of key proteins in the PI3K/Akt/mTOR signaling pathway in Eca109 cells (*P < 0.05, **P < 0.01 vs NC group).
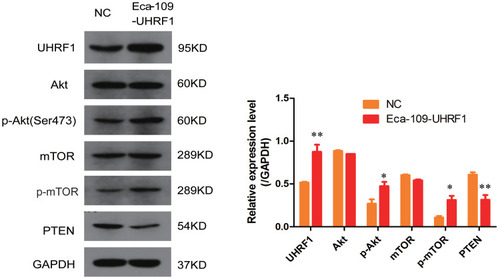
Figure 6 Effect of UHRF1 knockdown on PTEN methylation. (A) Western blot analysis of the expression of DNMT1 in the NC and shUHRF1 groups (**P < 0.01 vs NC group). (B) Methylation of the PTEN gene was measured by MSP; M: amplified using primers for methylated DNA, U: amplified using primers for unmethylated DNA. (C) PTEN mRNA was measured by RT-PCR. (**P < 0.01 vs NC group).
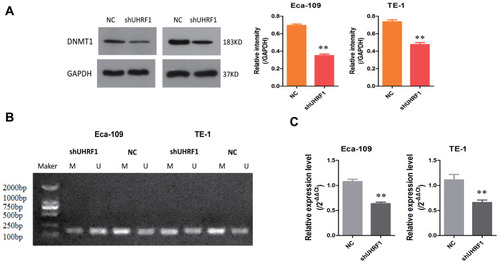
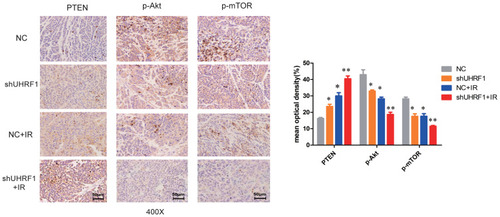
Figure 7 Representative images of immunohistochemical (IHC) staining of the PTEN, p-Akt, and p-mTOR proteins in xenograft mouse tumor samples (*P < 0.05, **P < 0.01 vs NC group).