Figures & data
Table 1 Patient Characteristics
Figure 1 (A) Distribution of CR vs non-CR in the MRIICT, MRICRT and MRICCT. (B) Distribution of the high sensitive group (H group) vs the moderate sensitive group (M group) in the MRIICT, MRICRT and MRICCT.
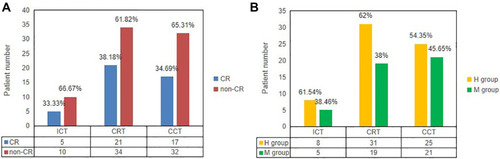
Table 2 Logistic Regression Analysis of Post-ICT Predictive Factors of CR and High Sensitivity to TNT
Table 3 Logistic Regression Analysis of Post-CRT Predictive Factors of CR and High Sensitivity to TNT
Table 4 Logistic Regression Analysis of Post-CCT Predictive Factors of CR and High Sensitivity to TNT
Table 5 Multivariate Analysis Results About Magnetic Resonance Imaging (MRI) Findings for the Prediction of CR and High Sensitivity to TNT
Figure 2 (A) ROC curves of predicting CR in the post-ICT MRI cohorts. (B) ROC curves of predicting CR in the post-CRT MRI cohorts. (C) ROC curves of predicting CR in the post-CCT MRI cohorts.
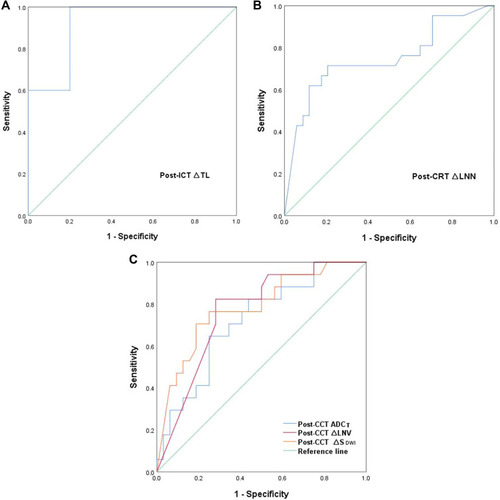
Figure 3 (A) ROC curves of predicting the high sensitive group (H group) in the post-ICT MRI cohorts.(B) ROC curves of predicting the high sensitive group (H group) in the post-CRT MRI cohorts. (C) ROC curves of predicting the high sensitive group (H group) in the post-CCT MRI cohorts.
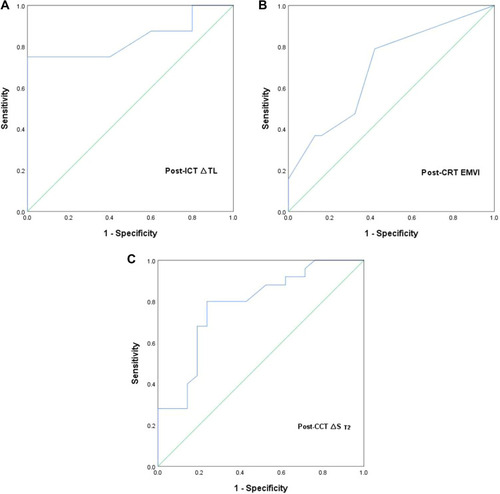
Figure 4 (A) ROC curves of predicting CR (combination of post-CCT ∆SDWI and post-CCT ∆LNV). (B) ROC curves of predicting CR (combination of post-CCT ∆SDWI and post-CCT ADCT). (C) ROC curves of predicting CR (combination of post-CCT ADCT and post-CCT ∆LNV). (D) ROC curves of predicting CR (combination of post-CCT ∆SDWI, post-CCT ADCT and post-CCT ∆LNV).
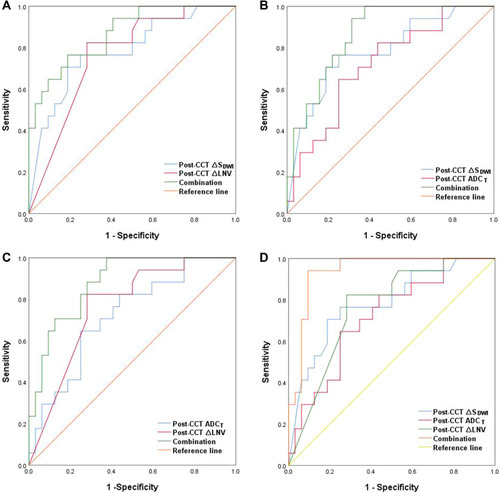
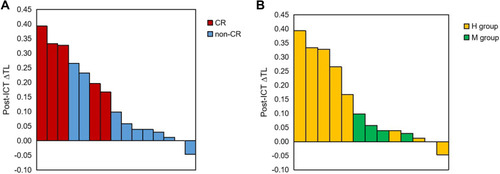
Figure 5 (A) Post - ICT ∆TL of CR vs non – CR for each patient. (B) Post - ICT ∆TL of the high sensitive group (H group) vs the moderate sensitive group (M group) for each patient.