Figures & data
Figure 1 The YBX1 expression profiles in different type of human cancers.
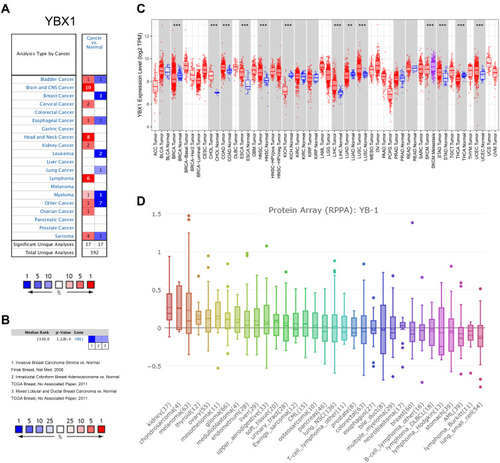
Figure 2 Subgroup analysis of YBX1 mRNA level in BRCA by UALCAN database.
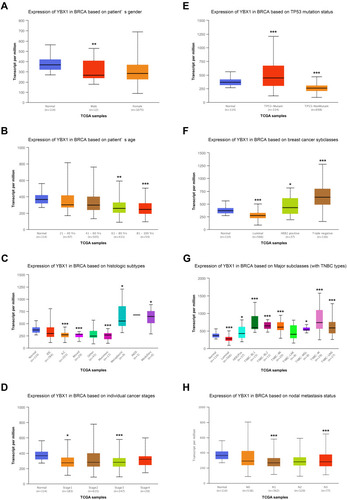
Figure 3 The correlation between YBX1 expression and clinicopathological parameters in BRCA.
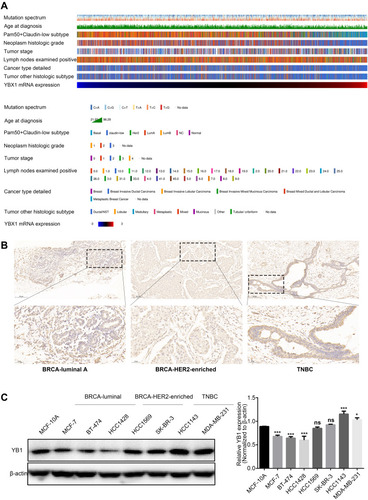
Table 1 Correlation of YBX1 Expression and Clinical Prognosis in Breast Cancer with Different Clinicopathological Parameters by Kaplan–Meier Plotter
Figure 4 Survival curves comparing the high and low expression of YBX1 in BRCA by Kaplan–Meier plotter database.
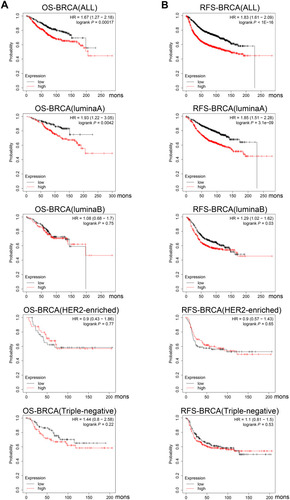
Table 2 Correlation Analysis Between YBX1 and Markers of Immune Infiltrates via TIMER
Figure 5 Correlation of YBX1 expression with immune cell infiltration level in (A) the entire BRCA cohort; (B) the luminal A subtype; (C) the luminal B subtype; (D) the HER2-enriched subtype; and (E) the triple-negative subtype by TIMER database.
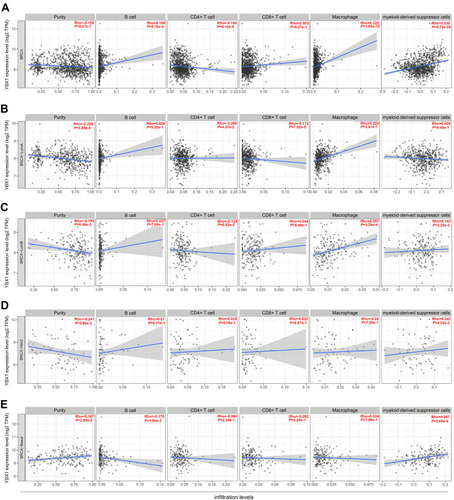
Figure 6 Verification of the correlation between YBX1 and immune cell infiltration in BRCA.
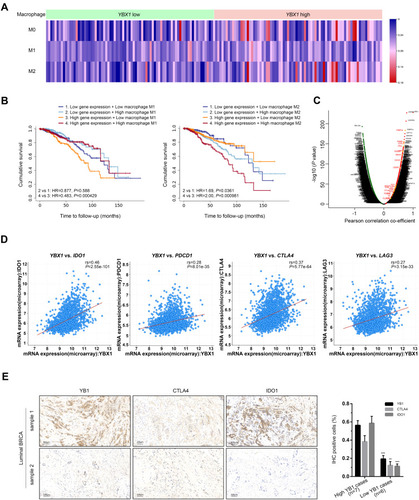
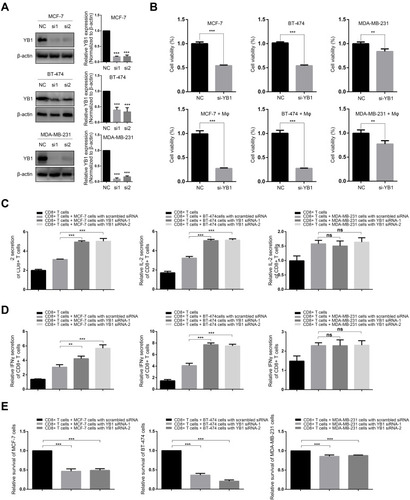
Figure 7 Effect of YBX1 knockdown on the cytotoxicity of macrophages and CD8+ T cells in co-culture system of BRCA cells and immunocytes.