Figures & data
Figure 1 Flow chart of rectal cancer patient selection for this study.
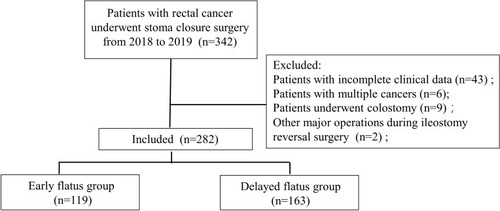
Table 1 Comparison of the Demographic and Clinical Characteristics
Table 2 Multivariate Logistic Regression Analysis
Figure 2 ROC curve of a new model for predicting the delayed flatus after ileostomy reversal in rectal cancer patients ROC AUC was 0.704 (95% CI: 0.647–0.757, P<0.001). When the Hosmer-Lemeshow method was used, the value of X2 was 10.399, P > 0.05.
Abbreviations: ROC, receiver operating characteristic; AUC, area under the receiver-operating characteristic curve.
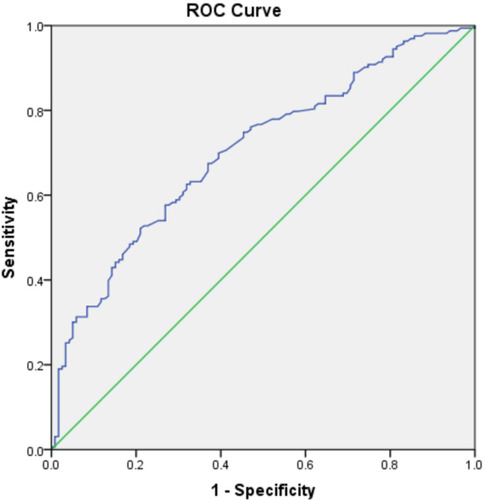
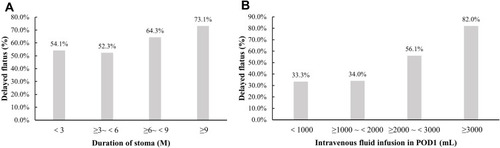
Figure 3 Association of delayed flatus with duration of stoma (A) or fluid infusion (B) the proportions of delayed flatus almost increased as the duration of stoma or intravenous fluid infusion POD1 increased.
Abbreviation: POD1, postoperative day 1.