Figures & data
Figure 1 Representative MRI results illustrating the cervical nodal necrosis (CNN) and extranodal extension (ENE) in two patients with NPC. (A) Axial T1WI and (B) Axial T2WI in a 41-year-old man with CNN (arrows); (C) Axial T1WI and (D) contrast-enhanced T1WI in a 45-year-old man with ENE infiltrating the adjacent muscle (stars).
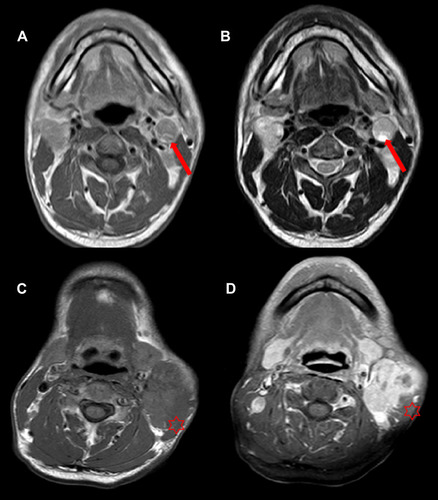
Table 1 Characteristics of 1752 Patients and Univariate Analysis
Table 2 Failure Patterns in Nasopharyngeal Carcinoma (NPC) Patients
Figure 2 Kaplan–Meier curves showing (A) DSS and (B) DMFS for the CNN and non-CNN groups.
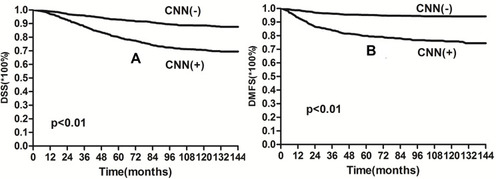
Figure 3 Kaplan–Meier curves showing (A) DSS and (B) DMFS for the ENE and non-ENE groups.
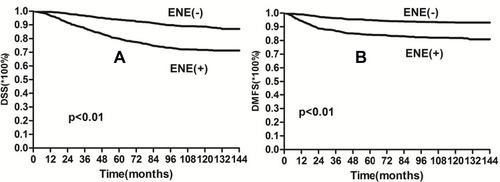
Table 3 Multivariate Analysis of Prognostic Factors
Figure 4 Nomogram (A) (without nodal features) and nomogram (B) (with nodal features) developed for the 5- and 10-year prediction of disease-specific survival (DSS).
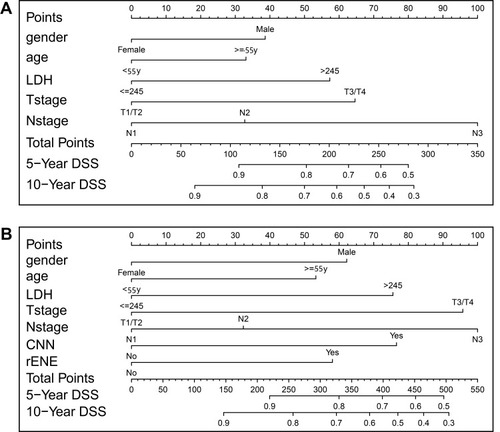
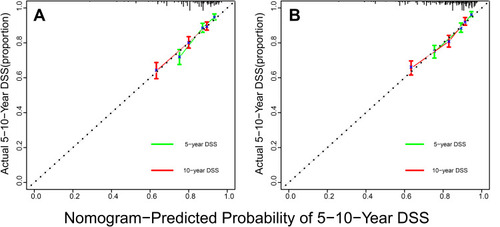
Figure 5 The calibration curve for predicting the 5- and 10-year DSS with nomogram (A) and nomogram (B).