Figures & data
Table 1 Baseline Characteristics of THCA Patients
Table 2 PCR Sequences of the Primers in This Study
Figure 1 LPAR5 and miR-513c-5p were found to be potential participants in THCA. (A) The intersection of DEGs from GSE6004 and GSE3678 data series with adjusted P<0.05 and |logFC|>1.5. (B) The PPI analysis of the intersected DEGs by STRING database. (C) The expression of LPAR5 in THCA from GEPIA database (http://gepia2.cancer-pku.cn/#analysis). * P < 0.01. (D) The relationship between LPAR5 expression level and the overall survival outcome (http://kmplot.com/analysis/). (E) The identification of the miRNA that links TNRC6C-AS1 and LPAR5 using starbase database.

Figure 2 Knock-out TNRC6C-AS1 inhibits proliferation of THCA cells. (A) The expression level of TNRC6C-AS1 was measured by qRT-PCR in the human thyroid follicular epithelial cell line (Nthy-ori 3–1) and THCA cell lines (TPC-1, BCPAP, and SW579). **P < 0.001 VS Nthy-ori 3–1. (B) The expression level of TNRC6C-AS1 was detected by qRT-PCR in THCA tissues and paired adjacent normal tissues. (C) RNA was extracted from the nuclei or cytoplasm of SW579 and TPC-1 cell lines. TNRC6C-AS1 localized in the nucleus and cytoplasm. (D) The expression level of TNRC6C-AS1 was measured by qRT-PCR in SW579 and TPC-1 cells transfected with siRNAs of TNRC6C-AS1 (si-lnc) and negative control of si-lnc (si-lnc-NC). (E) Silencing SW579 and TPC-1 by si-lnc significantly inhibited proliferation of SW579 and TPC-1 cells at 24, 48, 72 h, and 96h. Cell viability was detected by CCK-8 assay. (F) Cell proliferation was detected by BrdU assay in SW579 and TPC-1 cells transfected with si-lnc and si-lnc-NC. **P < 0.001 vs blank.
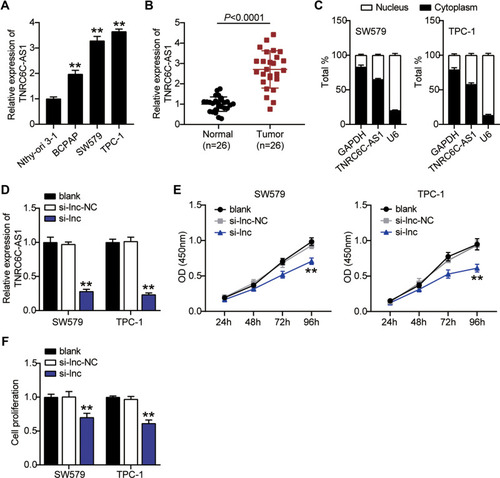
Figure 3 Knock-out TNRC6C-AS1 inhibits migration, invasion of THCA cells. (A) Silencing TNRC6C-AS1 inhibited the migration of SW579 and TPC-1 cells in wound healing assay. (B) Silencing TNRC6C-AS1significantly inhibited the invasion of SW579 and TPC-1 cells in a transwell assay. si-lnc, Silencing TNRC6C-AS1. **P < 0.001 vs blank.
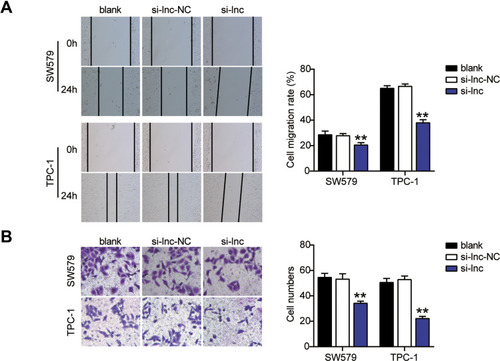
Figure 4 TNRC6C-AS1 interacts with and downregulates miR-513c-5p. (A) The putative binding site of TNRC6C-AS1 and miR-513c-5p is shown. (B) Luciferase activity was measured in SW579 and TPC-1 cells co-transfected with wild type (TNRC6C-AS1-Wt) or mutant (TNRC6C-AS1-Mut) TNRC6C-AS1 and miR-513c-5p using the luciferase reporter assay. **P < 0.001 vs miR-NC. (C) Anti-AGO2 RIP was performed in SW579 and TPC-1 cells transiently overexpressing miR-513c-5p followed by qRT-PCR to detect TNRC6C-AS1 associated with miR-513c-5p. **P < 0.001. (D) The expression level of miR-513c-5p was detected by qRT-PCR in THCA tissues and paired adjacent normal tissues. (E) Pearson correlation analysis of the correlation between TNRC6C-AS1 and miR-513c-5p in THCA tissues. (F) The expression level of miR-513c-5p was measured by qRT-PCR in the human thyroid follicular epithelial cell line (Nthy-ori 3–1) and THCA cell lines (TPC-1 and SW579). **P < 0.001 vs Nthy-ori 3–1. (G) The expression level of TNRC6C-AS1 and miR-513c-5p were measured by qRT-PCR in SW579 and TPC-1 cells transfected with si-lnc or miR-513c-5p inhibitor. si-lnc, Silencing TNRC6C-AS1. **P < 0.001 vs blank; ## P < 0.001 vs si-lnc+inhibitor.
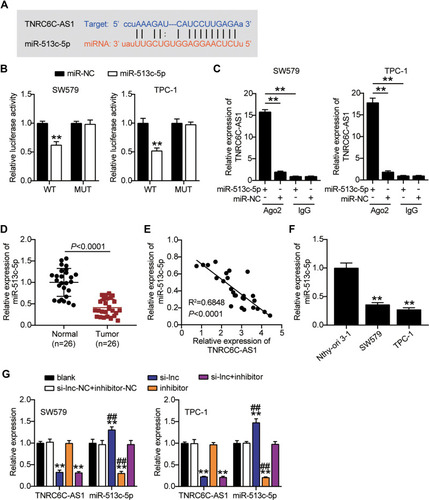
Figure 5 TNRC6C-AS1 accelerate proliferation of THCA cells through a miR-513c-5p-dependent way. (A) Viability of SW579 and TPC-1 cells with si-lnc or miR-513c-5p inhibitor transfection were detected by CCK-8 assay. (B) Proliferation of SW579 and TPC-1 cells with si-lnc or miR-513c-5p inhibitor transfection were detected by BrdU assay. si-lnc, Silencing TNRC6C-AS1. **P < 0.001 vs blank; ## P < 0.001 vs si-lnc+inhibitor.
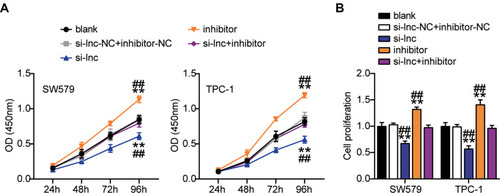
Figure 6 TNRC6C-AS1 accelerated migration and invasion of THCA cells through a miR-513c-5p-dependent way. (A) Migration of SW579 and TPC-1 cells with si-lnc or miR-513c-5p inhibitor transfection were detected by wound healing assay. (B) Invasion of SW579 and TPC-1 cells with si-lnc or miR-513c-5p inhibitor transfection were detected by transwell assay. si-lnc, Silencing TNRC6C-AS1. **P < 0.001 vs blank; ## P < 0.001 vs si-lnc+inhibitor.
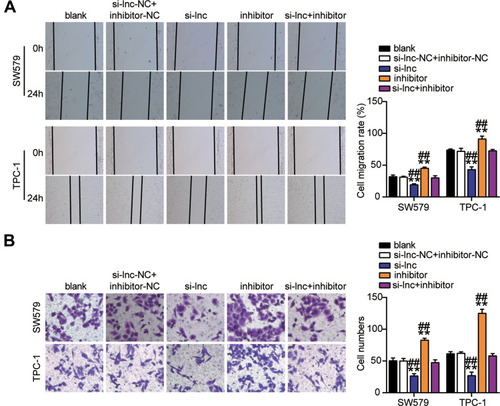
Figure 7 LPAR5 is the target gene for miR-513c-5p. (A) The putative binding site of LPAR5 and miR-513c-5p is shown. (B) Luciferase activity was measured in SW579 and TPC-1 cells co-transfected with wild type (LPAR5-Wt) or mutant (LPAR5-Mut) LPAR5 and miR-513c-5p using the luciferase reporter assay. **P < 0.001 vs miR-NC. (C) Biotinylated RNA pull-down assays were applied using Bio-NC and Bio-mimic. Relative enrichment of LPAR5 was measured by qRT-PCR. Bio-mimic, miR-513c-5p mimic. **P < 0.001 vs Bio-NC. (D) The expression level of LPAR5 was detected by qRT-PCR in THCA tissues and paired adjacent normal tissues. (E) Pearson correlation analysis of the correlation between LPAR5 and miR-513c-5p in THCA tissues. (F) The expression level of LPAR5 was measured by qRT-PCR in the human thyroid follicular epithelial cell line (Nthy-ori 3–1) and THCA cell lines (TPC-1 and SW579). **P < 0.001 vs Nthy-ori 3–1. (G) The mRNA expression level of LPAR5 were measured by Western blot in SW579 and TPC-1 cells transfected with miR-513c-5p mimic or miR-513c-5p inhibitor. Inhibitor, miR-513c-5p inhibitor. Mimic, miR-513c-5p mimic. (H) The protein expression level of LPAR5 were measured by Western blot in SW579 and TPC-1 cells transfected with miR-513c-5p mimic or miR-513c-5p inhibitor. Mimic, miR-513c-5p mimic. Inhibitor, miR-513c-5p inhibitor. Mimic, miR-513c-5p mimic. **P < 0.001 vs Mimic-NC; ## P < 0.001 vs Inhibitor-NC.
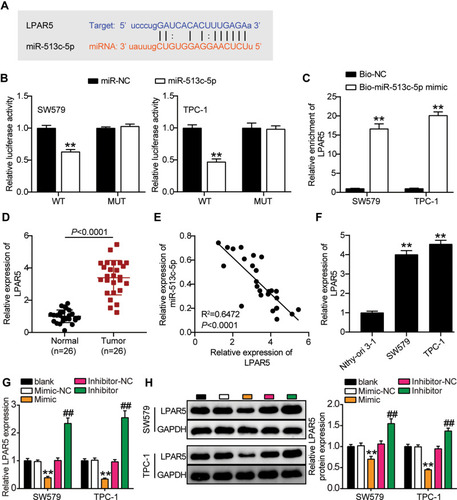
Figure 8 MiR-513c-5p inhibits proliferation of THCA cells through LPAR5. (A) The protein expression level of LPAR5 were measured by Western blot in SW579 and TPC-1 cells transfected with si-LPARS or miR-513c-5p inhibitor. (B) Viability of SW579 and TPC-1 cells with si-LPARS or miR-513c-5p inhibitor transfection were detected by CCK-8 assay. (C) Proliferation of SW579 and TPC-1 cells with si-LPARS or miR-513c-5p inhibitor transfection were detected by BrdU assay. si-LPARS, silencing LPARS. Inhibitor, miR-513c-5p inhibitor. NC, co-transfected with si-LPARS-NC and inhibitor-NC. **P < 0.001 vs blank; ## P < 0.001 vs si-LPAR5+inhibitor.
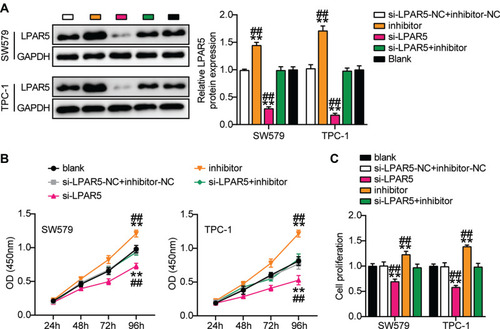
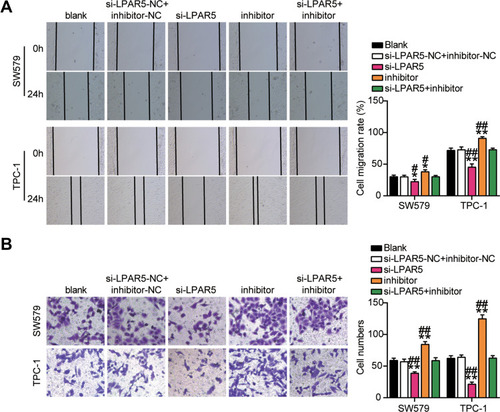
Figure 9 MiR-513c-5p inhibits migration and invasion of THCA cells through LPAR5. (A) Migration of SW579 and TPC-1 cells with si-LPARS or miR-513c-5p inhibitor transfection were detected by wound healing assay. (B) Invasion of SW579 and TPC-1 cells with si-LPARS or miR-513c-5p inhibitor transfection were detected by transwell assay. si-LPARS, silencing LPARS. Inhibitor, miR-513c-5p inhibitor. NC, co-transfected with si-LPARS-NC and inhibitor-NC. *P < 0.05, **P < 0.001 vs blank; #P < 0.05, ## P < 0.001 vs si-LPAR5+inhibitor.