
Figures & data
Figure 1 Radiological images of the proximal right tibia. Radiograph (A and B) and CT (C and D) showed osteolytic bony destruction. SPECT (E) images were negative for metastatic lesions.
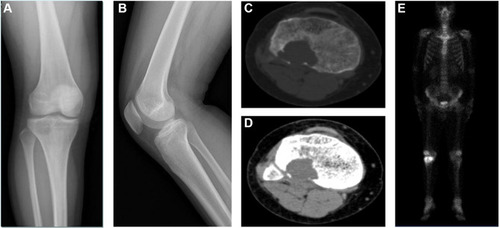
Figure 2 CT of the chest. (A) Local recurrence but without pulmonary metastasis. (B) Multiple pulmonary metastases were found and denosumab initiated. (C) 4 months after denosumab therapy. (D) 3 months after denosumab and apatinib therapy. (E) 15 months after denosumab and apatinib therapy. (F) 33 months after denosumab and apatinib therapy.
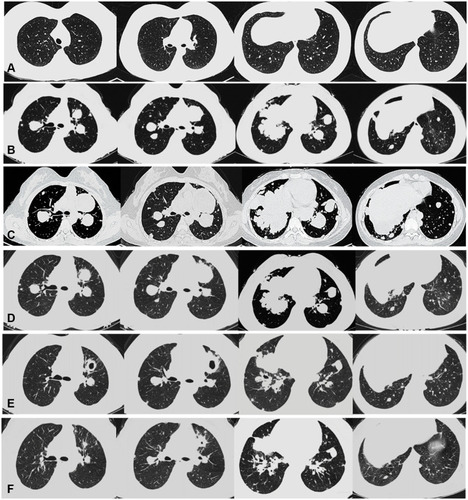
Figure 3 Pathological features of the local lesions. (A) High-magnification observation of numerous multinucleated giant cells (Hematoxylin and eosin stain, 200x). (B) High-magnification observation of local recurrence but without sarcomatous change (Hematoxylin and eosin stain, 200x). (C) Presence of multinucleated giant cells indicates a recurrence of GCTB (Immunohistochemical staining, 100x). (D) Expression of VEGFR-2 as assessed by immunohistochemistry (Immunohistochemical staining, 100x).
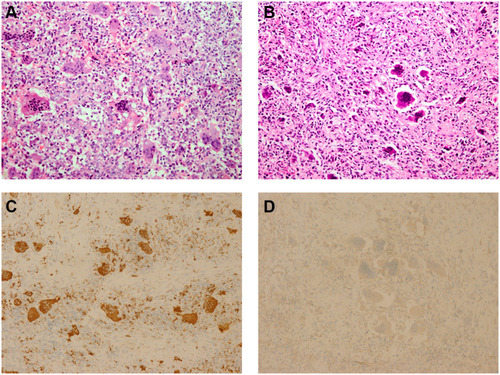
Figure 4 Radiological images of the proximal right tibia. Radiograph (A and B), postoperative films following the curettage and packing with cement; Radiograph (C and D), and CT (E, bone window) showed a circumferential lucency around the bone cement and local cortical bone destruction. MRI (F, T1-weight) showed a soft tissue mass.
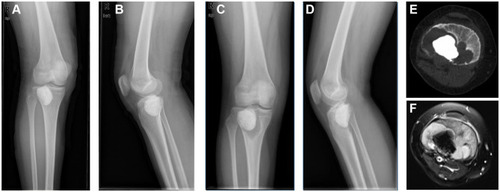
Table 1 Literature Review of Therapy After Progression of GCTB