Figures & data
Figure 1 High EDNRA expression is correlated with clinicopathologic features in patients with STAD. (A) Wilcoxon signed rank sum test was used to analyze the difference expression of EDNRA in STAD tissues and adjacent STAD tissues; (B) Wilcoxon signed rank sum test was used to detect the different expression of EDNRA in normal samples of GTEx combined adjacent STAD tissues and STAD samples; (C) the different expression of EDNRA in 27 STAD samples and matched adjacent samples; (D) ROC curve for EDNRA in normal samples of GTEx combined adjacent STAD tissues and STAD samples.
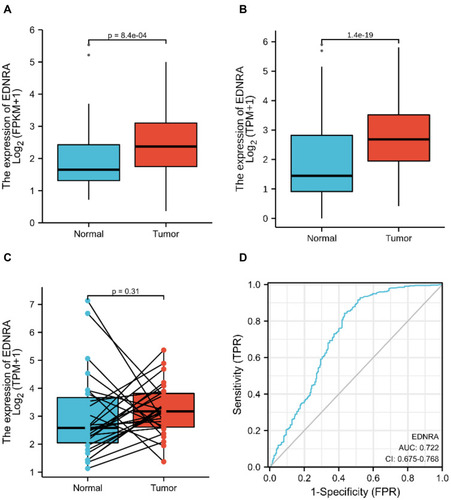
Table 1 Correlation Between EDNRA Expression and Clinicopathologic Characteristics of Patients with STAD
Table 2 EDNRA Expression Associated with Clinicopathologic Characteristics (Logistic Regression)
Figure 2 Box plot assessing EDNRA expression of patients with STAD according to different clinical characteristics. (A) T classification; (B) H. pylori infection; (C) pathologic stage.
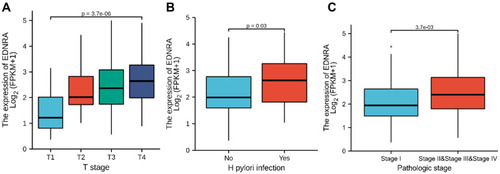
Table 3 Associations with Clinicopathologic Characteristics in STAD Patients Using Cox Regression
Figure 3 The independent risk and diagnostic value of EDNRA expression in STAD. (A) The survival analysis of overall survival (OS) of TCGA-STAD database; (B) Kaplan–Meier survival analysis of OS; (C) free progression (FP); (D) post progression survival (PPS).
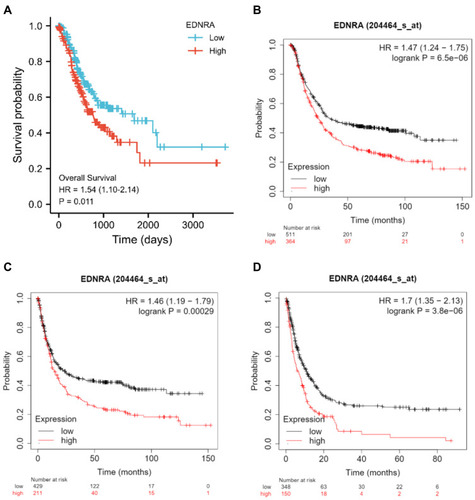
Figure 4 A nomogram for predicting probability of patients with 1-, 3- and 5-year overall survival (OS).
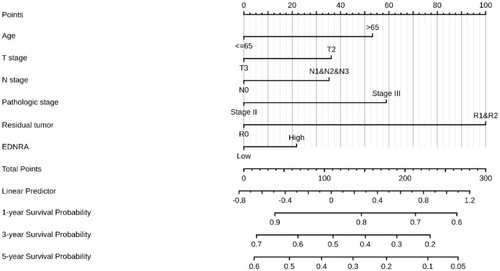
Figure 5 Forest plot of the multivariate Cox regression analysis in TCGA-STAD.
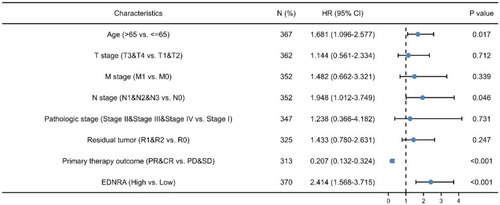
Figure 6 Enrichment plots from GSEA. (A–C) EDNRA-related signaling pathways in c2.cp.v7.2.symbols.gmt; (D–F) EDNRA-related signaling pathways in c5.all.v7.2.symbols.gmt (Gene ontology).
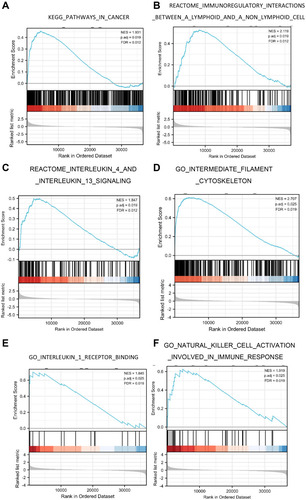
Figure 7 Immune Cell Infiltration Analysis of EDNRA in the TCGA-STAD. (A) The forest plot shows the correlation between EDNRA expression level and 24 immune cells; (B) the enrichment scores of EDNRA expression in NK cells and macrophages; (C) The correlation between EDNRA expression and macrophages; (D) the correlation between EDNRA expression and NK cells.
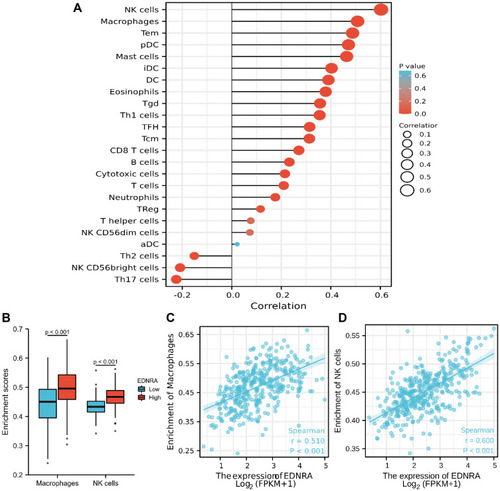
Figure 8 EDNRA expression levels in different types of cancers. (A) Compared with adjacent tissues, increased or decreased expression of EDNRA in Oncomine. (B) EDNRA expression levels in different types of cancers from TCGA datasets in TIMER, **P <0.01, ***P < 0.001.
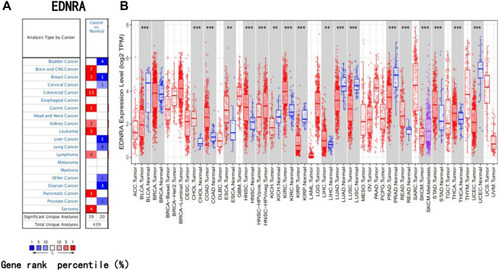
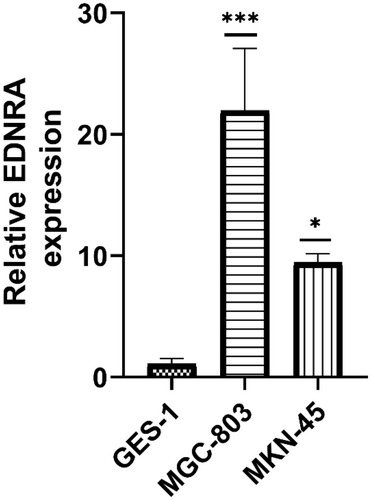
Figure 9 qRT-PCR of EDNRA expression in STAD cell lines (MGC-803, MKN-45) and human normal gastric epithelial cell line GES-1; *P < 0.05, ***P < 0.001.