
Figures & data
Figure 1 Receiver operating curve for response to neoadjuvant chemotherapy was plotted to determine the optimum cut-off for neutrophil-to-lymphocyte ratio (NLR).
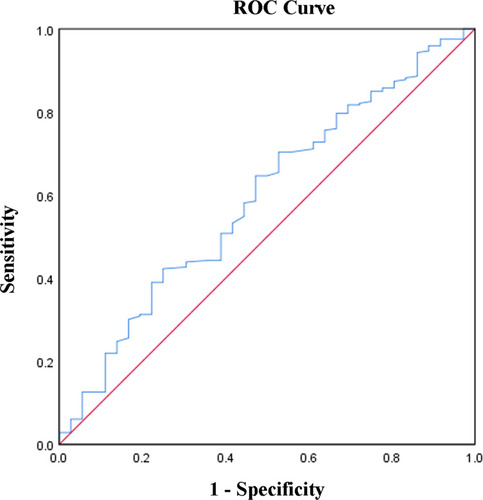
Table 1 Correlation Between Clinicopathological Parameters and NLR
Figure 2 The response to neoadjuvant chemotherapy in neutrophil-to-lymphocyte ratio (NLR) high and low groups.
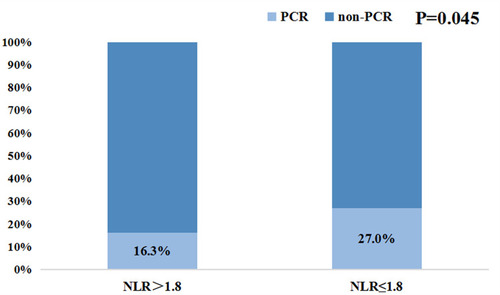
Table 2 Correlation Between NLR and LNR in Various Subtypes
Figure 3 The prognostic value of NLR for overall survival (A) and disease-free survival (B).
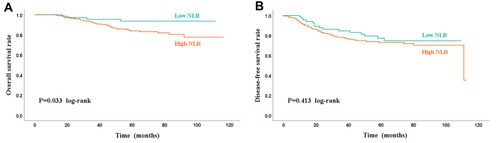
Figure 4 Kaplan–Meier analysis of overall survival and disease-free survival of patients undergoing axillary lymph node dissection in (A and B) positive lymph node ratio categories (LNRC) and (C and D) single LNR value (0.5).
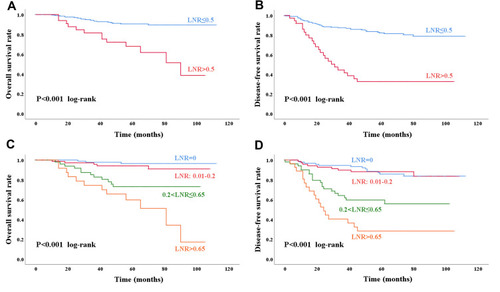
Table 3 Univariate Analysis of Factors Affecting Overall Survival and Disease-Free Survival
Table 4 Multivariate Analysis of Factors Affecting Overall Survival and Disease-Free Survival