
Figures & data
Figure 1 Screening flowchart.
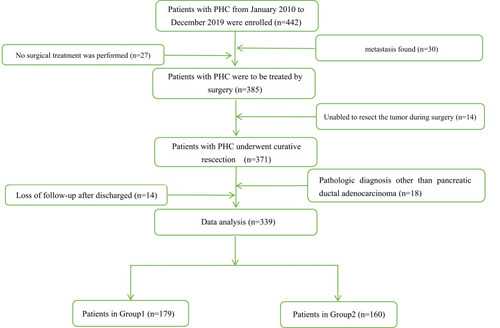
Figure 2 Time-dependent receiver operating characteristics curve. (The AUC of the CA19-9 to γ-glutamyltransferase ratio to predict the 1-year OS is 0.567.).
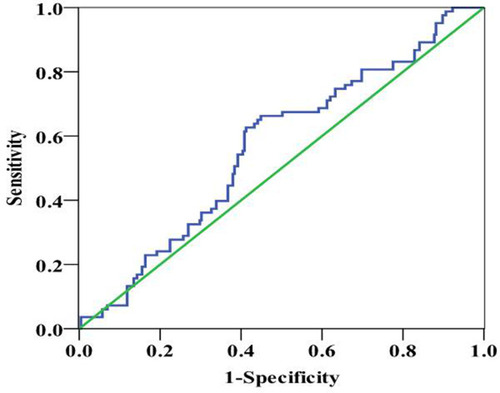
Figure 3 Long-term prognosis of patients with PHC. (A) Overall disease-free survival curve of patients; (B) overall survival curve of patients..
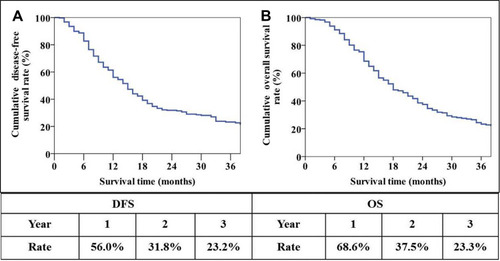
Table 1 Demographic and Pathologic Findings in the Two Groups of Patients with PHC
Table 2 Morbidity and Mortality in the Two Groups
Figure 4 Overall long-term prognosis between the two groups in patients with PHC. (A) Overall disease-free survival curve of the two groups of patients; (B) overall survival curve of the two groups of patients.
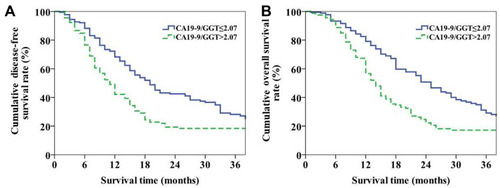
Table 3 Univariate Analysis of Risk Factors for PHC Recurrence
Table 4 Multivariate Analysis of Independent Risk Factors for PHC Recurrence
Table 5 Univariate Analysis of Long-Term Survival in Patients with PHC
Table 6 Multivariate Analysis of Long-Term Survival in Patients with PHC