Figures & data
Table 1 Overall Patient Characteristics
Figure 1 Expressions of LINC01224 and ZNF91 were up-regulated in radioresistant NSCLC cells. (A and B) The volcano diagram about differentially expresses lncRNAs and mRNAs between irradiation-resistant H1975/IR cells and irradiation-sensitive H1975 cells. (C) Up-regulation of LINC01224 expression in RNA-Seq experiment was validated by qRT-PCR. (D) The subcellular location of LINC01224, GAPDH and U6 served as cytoplasm and nucleus control respectively. (E and F) LINC01224 regulates the mRNA and protein expressions of ZNF91 was validated by qRT-PCR and Western blotting. (n=3, *P < 0.05).
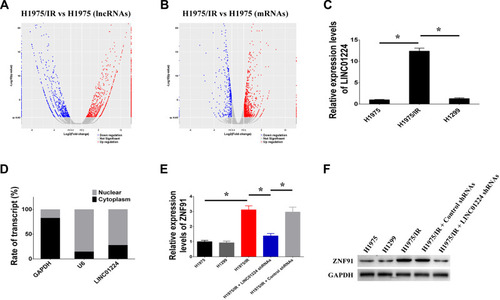
Figure 2 LINC01224 promote long-range interactions between the ZNF91 promoter and enhancer. (A) The positions of EcoRI restriction target fragments are marked by vertical lines and primers are designed accordingly and marked by bars. (B and C) The relative crosslinking frequencies between the ZNF91 enhancer region (anchor) and distal fragments (P1–P4) were measured by qRT-PCR and normalized to the fragment P1 region.
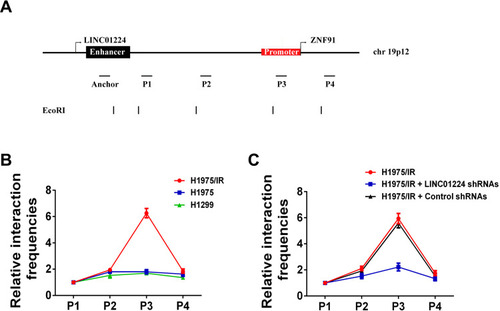
Figure 3 LINC01224 and ZNF91 regulated radioresistance. (A) Knockdown of LINC01224 and ZNF91 decreased resistance to irradiation in H1975/IR cells. (B) Knockdown of LINC01224 and ZNF91 increased irradiation (2 Gy) induced cell apoptosis in H1975/IR cells. (C) Knockdown of LINC01224 and ZNF91 increased irradiation (2 Gy) induced apoptosis marker cleaved caspase 3 in H1975/IR cells. (D) Overexpression of ZNF91 increased resistance to irradiation in H1975 and H1299 cells. (E) Overexpression of ZNF91 decreased irradiation (2 Gy) induced cell apoptosis in H1975 and H1299 cells. (F) Overexpression of ZNF91 decreased irradiation (2 Gy) induced apoptosis marker cleaved caspase 3 in H1975 and H1299 cells. (n=3, *P < 0.05).
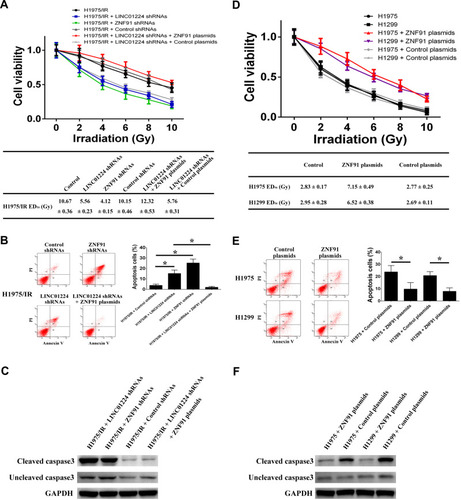
Figure 4 LINC01224 and ZNF91 regulated self-renewal capability. (A) Knockdown of LINC01224 and ZNF91 decreased the number and size of spheres formed by H1975/IR cells. (B) Overexpression of ZNF91 increased the number and size of spheres formed by H1975 and H1299 cells. (C) Knockdown of LINC01224 and ZNF91 decreased stem cell marker CD44 (intracellular and cell face expression) and ALDH1 in H1975/IR cells. (D) Overexpression of ZNF91 increased stem cell marker CD44 (intracellular and cell face expression) and ALDH1 in H1975 and H1299 cells. (E) Knockdown of LINC01224 and ZNF91 decreased cell invasion and migration in H1975/IR cells. (F) Overexpression of ZNF91 increased cell invasion and migration in H1975 and H1299 cells. (n=3, *P < 0.05).
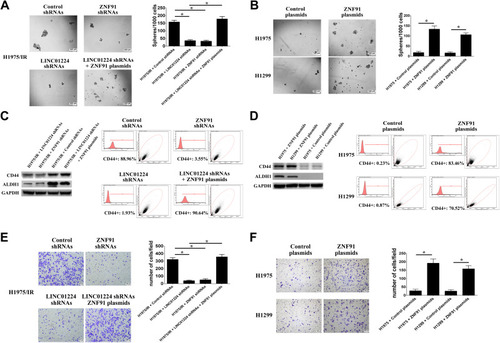
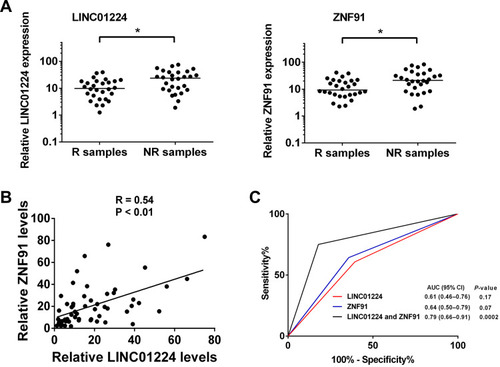
Figure 5 Expressions of LINC01224 and ZNF91 were associated with radiotherapy response. (A) Scatter plots of expression of LINC01224 and ZNF91 in NSCLC tissue samples. (*P < 0.05) (B) Correlation between the expression of LINC01224 and ZNF91 in NSCLC tissue samples, expressed using the Spearman correlation coefficients (R) and linear regression (solid lines). (C) ROC analyses assessing the association of LINC01224/ZNF91 expression levels and radiotherapy response of NSCLC patients. Expression levels of LINC01224 and ZNF91 were dichotomized and their categories represented by the score of 1 or 0 as follows: score 1 = LINC01224 or ZNF91 levels ≥ median; score 0 = converse of criteria for score 1. Combined analyses of LINC01224 and ZNF91 used the sum of scores.