Figures & data
Figure 1 The expression of MCF2L-AS1 was enhanced in CRC/OXA cells and samples of serum. MCF2L-AS1 levels were assessed in CRC/OXA cells (A) and serum (B) via qPCR. (C) CRC patient overall survival was assessed via the Kaplan-Meier approach. **p < 0.01.
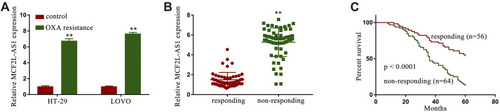
Figure 2 Knocking down MCF2L-AS1 suppressed CRC/OXA cell survival and resistance to oxaliplatin. (A) MCF2L-AS1 levels in sh-NC and sh-MCF2L-AS1 CRC/OXA cell groups were assessed via qPCR. OXA IC50 values and cell survival in sh-NC and sh-MCF2L-AS1 groups treated with a range of OXA concentrations were determined via MTT assay for HT-29/OXA (B) and LOVO/OXA (C) cells. **p < 0.01.
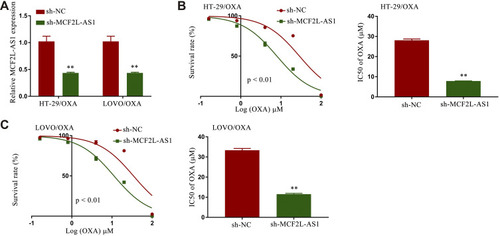
Figure 3 MCF2L-AS1 knockdown suppresses in vivo OXA resistance. Tumor volume (A and B) and overall survival (C and D) were examined in vivo in OXA-treated sh-NC and sh-MCF2L-AS1 groups. **p < 0.01.
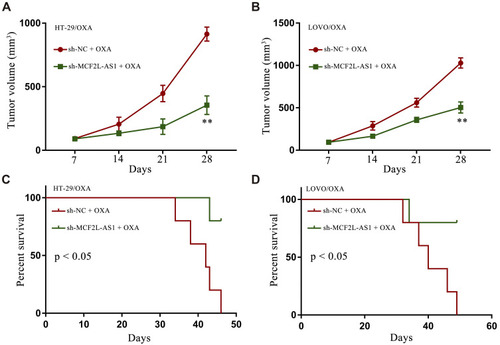
Figure 4 Sh-MCF2L-AS1 suppresses CRC/OXA cell survival and oxaliplatin resistance, while miR-105 inhibition reverses this effect. (A) Interactions between miR-105 and MCF2L-AS1 were predicted with StartBase 2.0. (B) Luciferase reporter assays were conducted as a means of measuring luciferase activity. (C and D). MCF2L-AS1 enrichment within CRC/OXA cells was assessed via a RIP assay approach. (E and F). Biotin-coupled sense or antisense DNA probes specific for MCF2L-AS1 were combined with lysates prepared from CRC/OXA cells, after which RNA was pulled down and qPCR was conducted. (G) miR-105 levels in CRC/OXA cells were assessed via qPCR. (H and I). Cell survival and OXA IC50 values were measured via MTT assay for CRC/OXA cells. **p < 0.01.
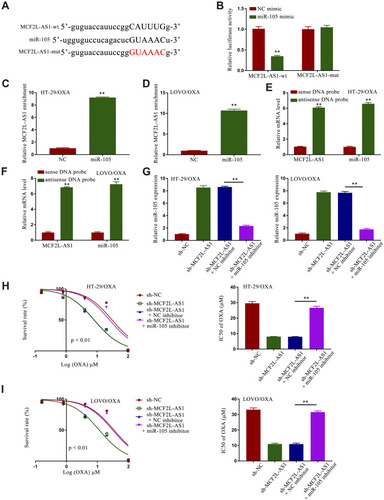
Figure 5 miR-105 overexpression results in the inhibition of IL-1β and the suppression of CRC/OXA cell survival and oxaliplatin resistance. (A) Binding interactions between miR-105 and IL-1β were predicted with TargetScanHuman 2.0. (B) Luciferase assays were used to quantify luciferase activity. Levels of IL-1β expression in CRC/OXA cells were quantified via qPCR (C and E) and ELISA (D and F). (G and H). Cell survival and OXA IC50 values were measured via MTT assay for CRC/OXA cells. **p < 0.01.
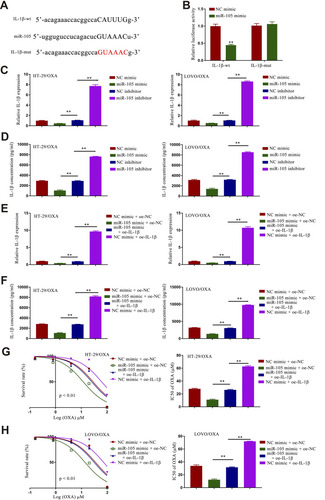
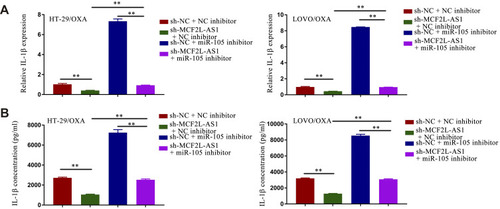
Figure 6 MCF2L-AS1 targets miR-105 and thereby regulates IL-1β in CRC/OXA cells. The expression of IL-1β in these cells was assessed via qPCR (A) and ELISA (B). **p < 0.01.