Figures & data
Table 1 Patients’ Demographics and Clinicopathological Characteristics
Figure 1 Correlation matrix of candidate features. Values in this matrix demonstrated the correlation coefficient of each corresponding variable.
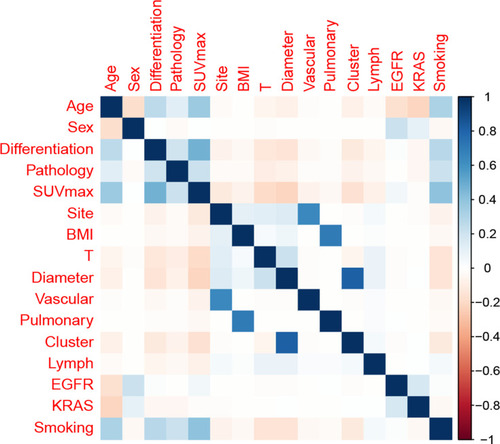
Figure 2 Random forest model. (A) The candidate factors associated with micrometastasis of lymph nodes were ordered according to the mean decreased Gini index. (B) Relationship of dynamic changes between the prediction error and the number of decision trees. (C) Performance of the prediction model with increasing numbers of features in the tenfold cross-validation.
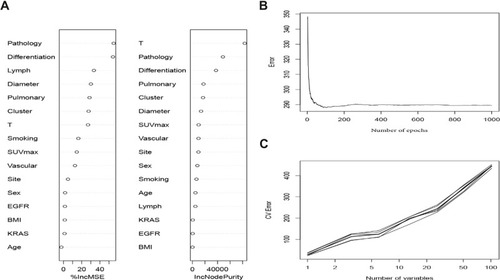
Table 2 The Predictive Performances of Different Models Associated with Micrometastasis of Lymph Nodes
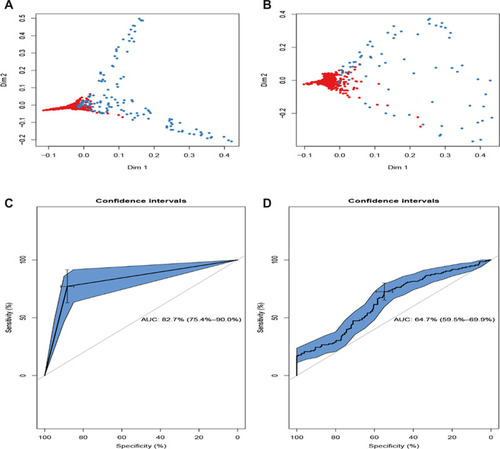
Figure 3 Validation and comparison of the predictive model. The training set (A) and testing set (B) associated with micrometastasis of lymph nodes were measured via the RF model. The comparison of the ROC curve of the RF model (C) and GL model (D).