Figures & data
Table 1 Baseline Characteristics of 255 Patients with NSCLC with Solid Metastases and 33 Patients with NSCLC with Cystic Metastases
Table 2 Baseline Characteristics of Patients According to Treatment Regimens in Cohort 2
Figure 1 The brain enhanced MRI of a 61-year-old woman with non-small cell lung cancer and EGFR 21L858R mutation before and after EGFR-TKI treatment. The positions indicated by the arrows are the lesions. (A) Contrast-enhanced T1-weighted MR image at baseline. (B) Contrast-enhanced T2-weighted MR image at baseline. (C) Contrast-enhanced T1-weighted MR image after icotinib (first-generation EGFR-TKI) treatment and whole brain radiotherapy (prescription dose and fraction schedule of 30Gy/10F) treatment for 1 month. (D) Contrast-enhanced T2-weighted MR image after icotinib and whole brain radiotherapy treatment for 1 month.
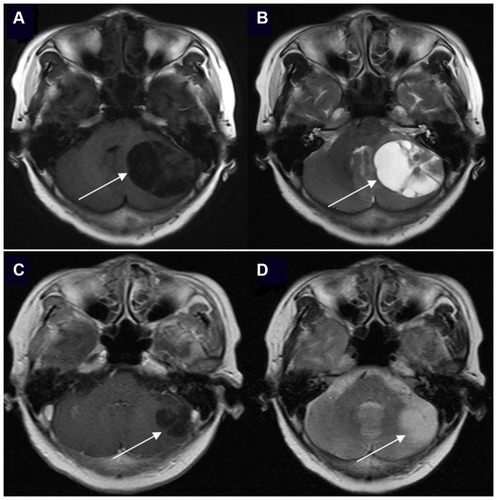
Figure 2 Kaplan–Meier estimates of progression-free survival with 33 patients in cohort 2, according to the different treatments: (A) Targeted drugs and chemotherapy treatment (12.6 months vs 6.3 months, P=0.001). (B) Median iPFS between targeted regimens and chemotherapy treatment (8.4 months vs 6.0 months, P=0.042).
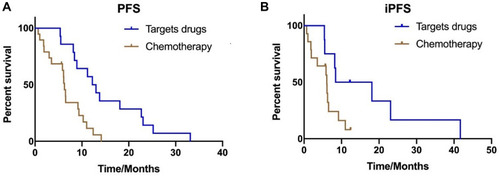
Figure 3 Kaplan–Meier estimates of intracranial progression-free survival with all patients in two cohorts, according to different types of brain metastases. (A) Solid brain metastases and cystic brain metastases (15.4 months vs 9.9 months, P=0.015). (B) Median iPFS between solid brain metastases and cystic brain metastases without targeted therapy (11.7 months vs 6.5 months, P=0.003).
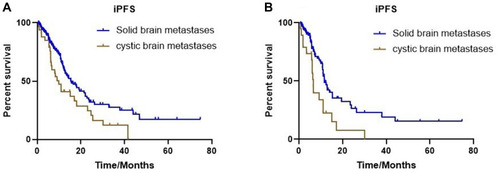
Figure 4 Kaplan–Meier estimates of overall survival in patients receiving targeted drugs, according to different types of brain metastases: solid brain metastases and cystic brain metastases (23.4 vs 47.9 months; P=0.013).
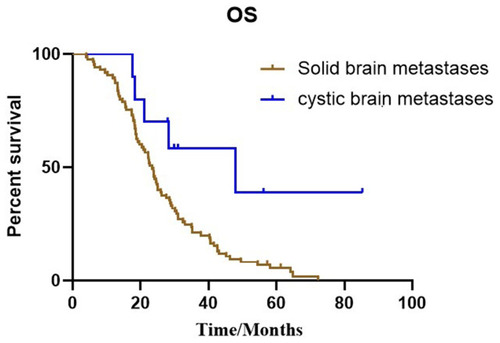
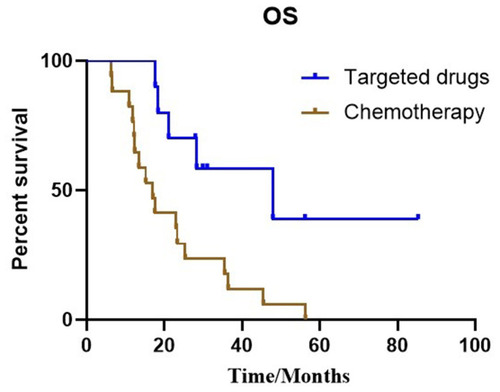
Figure 5 Kaplan–Meier estimates of overall survival according to different treatments in patients with cystic BM: targeted drugs and chemotherapy (47.9 months vs 17.0 months, P=0.007).