Figures & data
Table 1 Initial Clinical Characteristics of Small-Cell Neuroendocrine Carcinoma of Gynecologic Tract for 34 Patients
Table 2 Immunohistochemical Staining Results in Small-Cell Neuroendocrine Carcinoma of Gynecologic Tract for 34 Patients
Figure 1 Pathological staining images for small-cell neuroendocrine carcinoma of the gynecologic tract (SCNCGT). (A) The small-cell neuroendocrine carcinoma of the endometrium (SCNCE) was characterized by small cells with scant cytoplasm (hematoxylin and eosin stain (H&E); magnification ×200). (B) The SCNCE was positive for chromogranin A and neuron-specific enolase (H&E; original magnification, ×100). (C) The SCNCE was positive for synaptophysin (H&E; original magnification, ×100). (D) The SCNCE was positive for chromogranin A (H&E; original magnification, ×100). (E) The small-cell neuroendocrine carcinoma of the ovary (SCNCO) was characterized by small cells with scant cytoplasm (H&E; magnification ×200). (F) The SCNCO was positive for neuron-specific enolase (H&E; original magnification, ×100). (G) The SCNCO was positive for synaptophysin (H&E; original magnification, ×100). (H) The SCNCO was positive for chromogranin A (H&E; original magnification, ×100). (I) The small-cell neuroendocrine carcinoma of the cervix (SCNCC) was characterized by small cells with scant cytoplasm (H&E; magnification ×200). (J) The SCNCC was positive for neuron-specific enolase (H&E; original magnification, ×100). (K) The SCNCC was positive for synaptophysin (H&E; original magnification, ×100). (L) The SCNCC was positive for chromogranin A (H&E; original magnification, ×100).
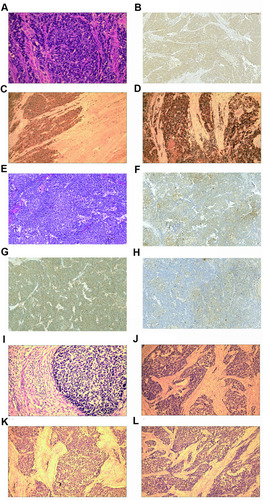
Table 3 Treatment and Recurrence of Small-Cell Neuroendocrine Carcinoma of Gynecologic Tract for 34 Cases
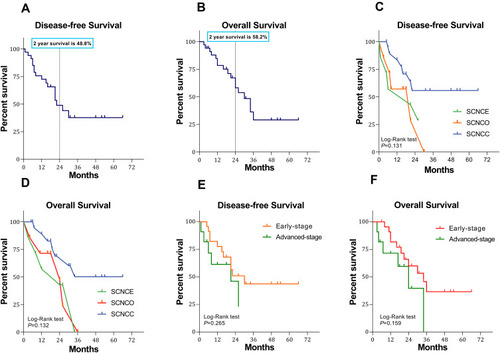
Figure 2 Survival curves of all 34 patients with small-cell neuroendocrine carcinoma of the gynecologic tract (SCNCGT). (A) Kaplan–Meier curve showing the disease-free survival (DFS) rate in patients with SCNCGT. (B) Kaplan–Meier curve showing the overall survival (OS) rate in patients with SCNCGT (C) Kaplan–Meier curve showing the DFS rate in patients with small-cell neuroendocrine carcinoma of the endometrium (SCNCE), ovary (SCNCO), and cervix (SCNCC), respectively. Log rank test resulted in P = 0.131. (D) Kaplan–Meier curve showing the OS rate in patients with small-cell neuroendocrine carcinoma of the endometrium (SCNCE), ovary (SCNCO), and cervix (SCNCC), respectively. Log rank test resulted in P = 0.132. (E) Kaplan–Meier curve showing the DFS rate in patients with early-stage and advanced-stage disease, respectively. Log rank test resulted in P = 0.265. (F) Kaplan–Meier curve showing the OS rate in patients with early-stage and advanced-stage groups, respectively. Log rank test resulted in P = 0.159.