Figures & data
Table 1 Basic Information of Esophageal Squamous Cell Carcinoma
Table 2 Association Between Circ_0014715 Expression and Clinicopathological Characteristics of Patients
Figure 1 The characteristics of circ_0014715 in ESCC tissues and cell lines. (A) qRT-PCR assay indicated the high expression of circ_0014715 in 67 human ESCC tissue samples in comparison with paired normal tissue samples. (B) Relative circ_0014715 expression in ESCC cell lines and Het-1A cells was detected by qRT-PCR. (C) ROC curve was used to calculate the diagnostic value. (D) qRT-PCR was performed using divergent or convergent primers to detect the presence of circ_0014715 as a circular structure in ECA-109 cells. GAPDH was used as a blank control. (E) The mRNA expression of circ_0014715 and CCT3 was detected. (data are shown as the mean±SD.*P<0.05, ***P<0.001, ****P<0.0001).
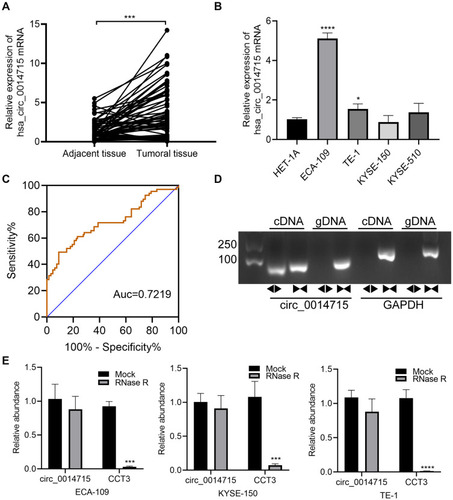
Figure 2 Circ_0014715 silencing inhibits cell proliferation. (A) Circ_0014715 was effectively down-regulated after transfection in ECA-109 and TE-1 cells. (B) Colony formation assay of the transfected cells with circ_0014715 silencing vectors. (Data are shown as the mean±SD. *P<0.05, **P<0.01, ***P<0.001, ****P<0.0001).
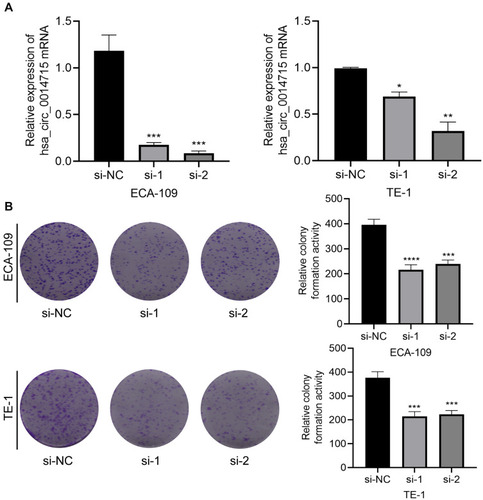
Figure 3 Circ_0014715 silencing inhibits cell proliferation. (A) Cell viability was detected by CCK-8 after circ_0014715 silencing. (B) After circ_0014715 was down-regulated, DNA synthesis in ECA-109 and TE-1 cells was observed by EdU assay. (Data are shown as the mean±SD. **P<0.01, ***P<0.001, ****P<0.0001, si-NC vs si-1, #P<0.05, ###P<0.001, ####P<0.0001, si-NC vs si-2).
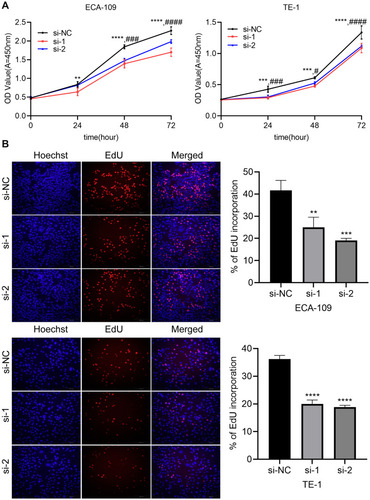
Figure 4 Circ_0014715 silencing inhibits ESCC cell migration and invasion. (A) The migration and invasion ability of ECA-109 and TE-1 cells were detected by Transwell after circ_0014715 knockdown. (B) Wound healing assays were used to observe changes in cell migration after transfection. (Data are shown as the mean±SD. *P<0.05, **P<0.01, ***P<0.001, ****P<0.0001).
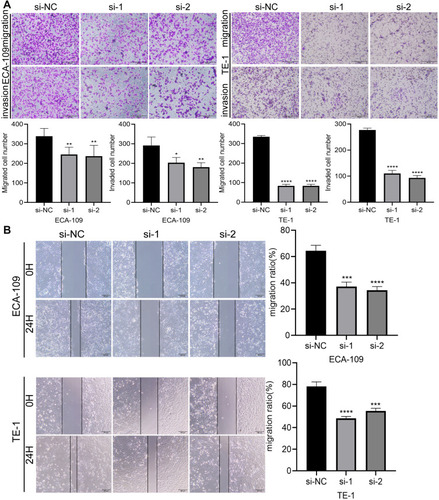
Figure 5 Downregulation of circ_0014715 blocks cell cycle progression and induces cell apoptosis. (A) Flow cytometric analysis was used to detect the apoptosis of ECA-109 and TE-1 cells. (B) Cell cycle distribution of ECA-109 and TE-1 was determined by flow cytometry. (Data are shown as the mean±SD. *P<0.05, **P<0.01, ****P<0.0001).
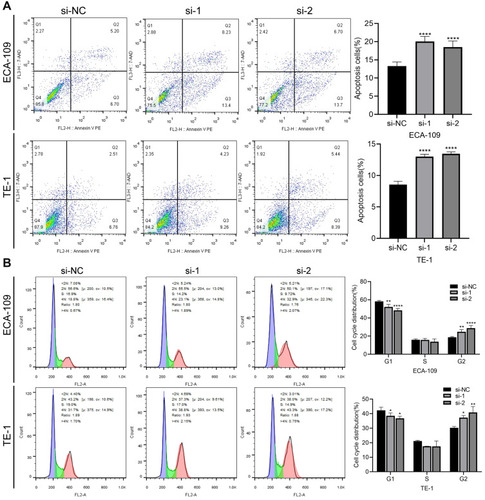
Figure 6 Overexpression of circ_0014715 promoted cell proliferation. (A) Circ_0014715 plasmids overexpressed circ_0014715. (B) CCK-8 assay showed that overexpression of circ_0014715 promoted proliferation of KYSE-150. (C) EdU assay showed that overexpressed circ_0014715 could promote the proliferation. (D) Colony formation assay of KYSE-150 cells transfected with circ_0014715 plasmids detected cell proliferation. (Data are shown as the mean±SD. **P<0.01, ***P<0.001, ****P<0.0001).
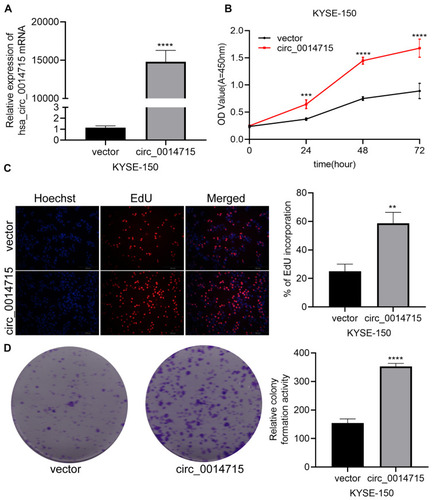
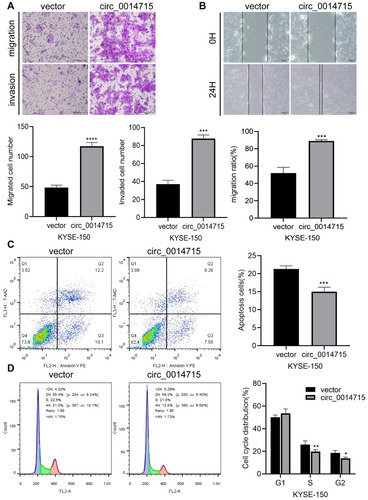
Figure 7 Overexpression of circ_0014715 increased migration potential and resistance to cell apoptosis. (A) Transwell assays showed that the migrated and invasive ability of KYSE-150 cells increased after circ_0014715 overexpression. (B) Cell migration was assessed using a wound healing test. (C) The apoptosis of KYSE-150 cells was detected by cytometry. (D) Flow cytometry was performed to detect the cell cycle distribution. (Data are shown as the mean±SD. *P<0.05, **P<0.01, ***P<0.001, ****P<0.0001).