
Figures & data
Figure 1 A typical case with positive CDKAL1 expression (A) and a typical case with negative CDKAL1 expression (B). Scale bar = 90 μm; magnification ×400.
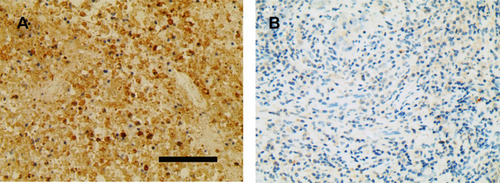
Table 1 Comparison of Clinical Characteristics Between the CDKAL1-Negative Group and the CDKAL1-Positive Group
Table 2 Univariate and Multivariate Analyses of Prognostic Factors for OS
Figure 2 Kaplan–Meier curves of OS (A) and PFS (B) of all patients.
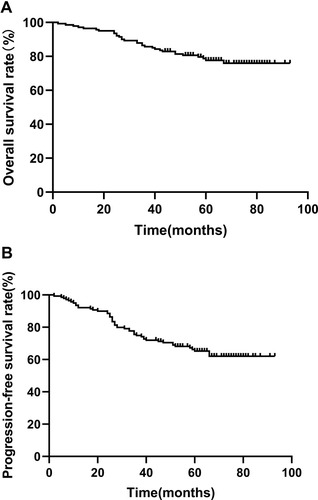
Figure 3 Kaplan-Meier curves of OS (A) and PFS (B) of the CDKAL1-negative group (red) and the CDKAL1-positive group (black).
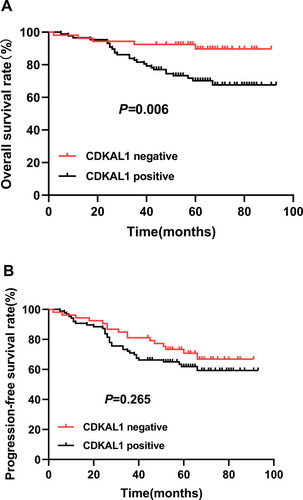
Table 3 Univariate and Multivariate Analyses of Prognostic Factors for PFS