Figures & data
Figure 1 Circ-0003006 is highly expressed in hepatocellular carcinoma. (A) Bioinformatic analysis the circ-0003006 in the GEO database (GSE97332). (B) q-RT-PCR analysis the circ-0003006 expression in normal liver tissues and HCC. (C) qRT-PCR is performed to verify the expression of circ-0003006 in HCC cell lines. (D and E) The RNA nucleoplasmic separation and FISH assay analysis the cell location of circ-0003006. Data indicate the means ± SEM of three experiments, *p < 0.05, **p< 0.01.
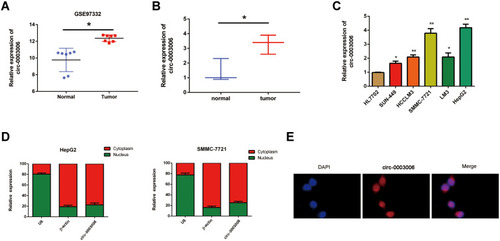
Figure 2 Circ-0003006 was induced by ZEB1 in hepatocellular carcinoma cell. (A) Bioinformatic analysis prediction of the upstream transcription factors of circ-0003006. (B) q-RT-PCR analysis the circ-0003006 expression in the potential transcription factors knockdown. Data indicate the means ± SEM of three experiments, *p < 0.05.
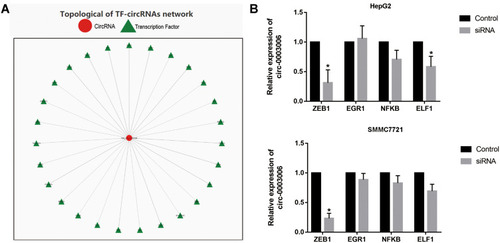
Figure 3 Silencing of circ-0003006 hindered hepatocellular carcinoma cell proliferation and metastasis in vitro. (A) HepG2 and SMMC-7721 cell lines are transfected with NC or sh-circ-0003006(sh-circ#1, sh-circ#2) and qRT-PCR analysis demonstrates that the transfection is successful. (B) CCK8 experimental results for the growth of hepatocellular carcinoma upon knockdown of sh-circ-0003006. (C and D) Transwell assay determined the migration and invasion of hepatocellular carcinoma cells transfected with sh-circ-0003006. Data indicate the means ± SEM of three experiments, *p < 0.05, **p< 0.01.
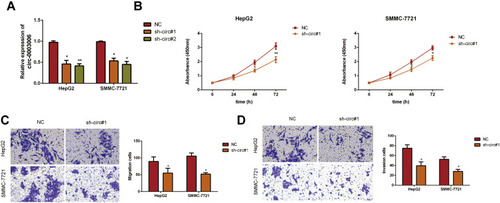
Figure 4 Circ-0003006 silencing suppresses the growth of HCC cell in vivo. (A) Representative images of xenografts tumor (five mice per group) in nude mice. (B and C) The volume(b) and weights(c) of xenograft tumors. (D) Immunostaining of Ki-67 expression in xenograft tumors. Data indicate the means ± SEM of three experiments, *p < 0.05, **p<0.01.
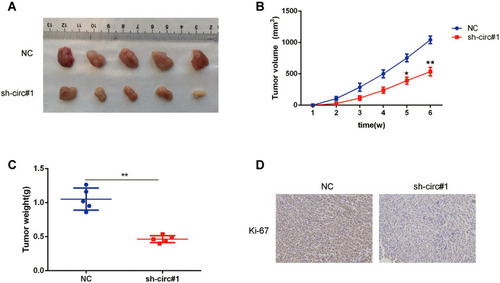
Figure 5 Circ-0003006 functions as a sponge of miR-542-3p. (A) The relative levels of 4 miRNA candidates were examined by qRT-PCR. Multiple miRNAs were pulled-down by circ-0003006 probe. (B) AGO2 RIP assay analysis the binding correlation of circ-0003006 and miR-542-3p. (C) Schematic representation of the potential binding site of miR-542-3p on circ-0003006 and mutant binding sites. (D) The relative luciferase activity of mimics of miR-542-3p on the luciferase reporter plasmid with wild type circ-0003006 sequence (WT) or both mutant binding sites of circ-0003006 (Mutation). (E) q-RT-PCR assay analysis of the miR-542-3p expression in circ-0003006 knockdown HCC cells. (F) The expression of miR-542-3p in the HCC tissues and normal liver tissues. (G) Correlation analysis of miR-542-3p and circ-0003006 expression. Data indicate the means ± SEM of three experiments, **p< 0.01.
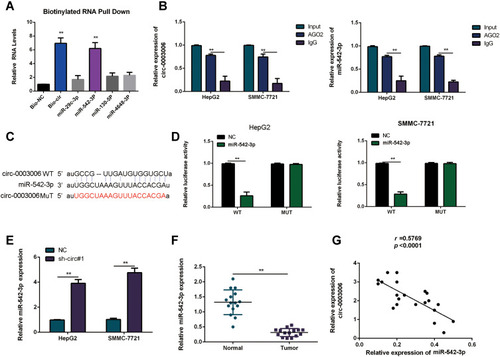
Figure 6 Circ-0003006 sequestered miR-542-3p to regulate HIF-1A in HCC. (A) q-RT-PCR assay analysis of HIF-1A expression in the miR-542-3p mimic group HCC cells. (B) Schematic representation of the potential binding site of miR-542-3p on HIF-1A and mutant binding sites. (C and D) The relative luciferase activity of mimics of miR-542-3p on the luciferase reporter plasmid with wild type HIF-1A sequence (WT) or both mutant binding sites of HIF-1A (Mutation). (E and F) q-RT-PCR and western-blots assay analysis of HIF-1A in the miR-542-3p and circ-0003006 overexpressed. (G and H) q-RT-PCR and western-blots assay analysis of HIF-1A in the HCC tissues and normal liver tissues. (I) Correlation analysis of miR-542-3p and HIF-1A expression. Data indicate the means ± SEM of three experiments, *p < 0.05, **p< 0.01.
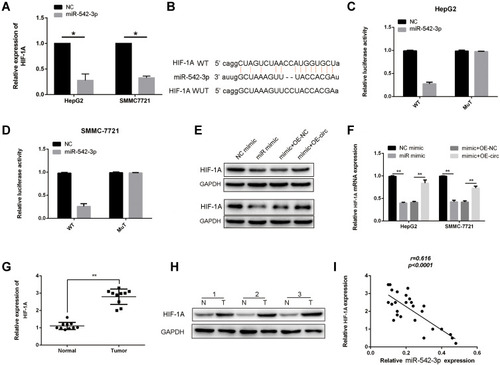
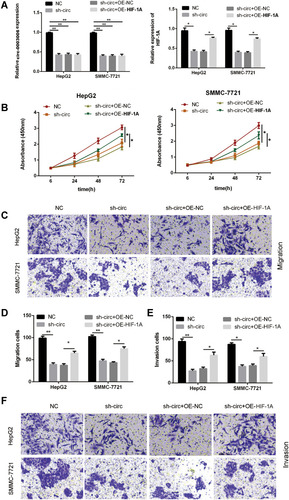
Figure 7 Circ‑0003006 mediates HIF-1A expression to promote HCC progression via miR‑542‑3p. (A) q-RT-PCR analysis of the circ-0003006 and HIF-1A expression in HepG2 and SMMC7721 cell transfected with Sh-NC, Sh-circ-0003006, Sh-circ-0003006 + OE-NC, Sh-circ-0003006 + OE-HIF-1A. (B) CCK8 analysis the proliferation in indicated groups of HepG2 and SMMC7721 cell. (C–F) Transwell assay analysis the proliferation in indicated groups of HepG2 and SMMC7721 cell. Data indicate the means ± SEM of three experiments, *p < 0.05, **p< 0.01.