
Figures & data
Figure 1 Flow diagram of the included population. A total of 467 elderly gastric cancer patients were screened, of which 13 lacked preoperative PNI-related data and were excluded from the cohort. The remaining 454 patients were enrolled in the study.
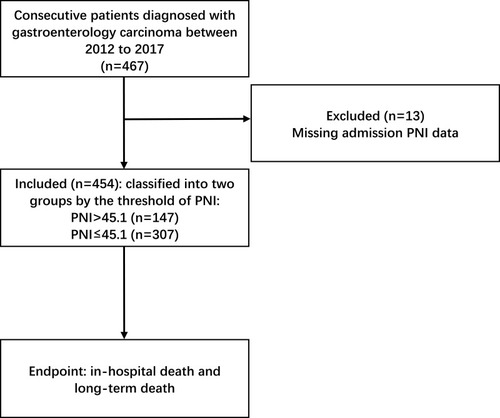
Figure 2 The optimal cutoff value of PNI. The optimal cutoff value of PNI was determined by X-tile software (Yale University, New Haven, CT), using overall survival as the primary outcome in patients from the training cohort. (A, D, and G) The coloring of the plot represents the strength of the association, ranging from low (dark, black) to high (green or red). Indirect associations between factor expression and survival are colored red, whereas positive associations are colored green. (B, E, and H) The histogram shows the optimal cutoff point for the whole group, the young elderly subgroup, and the old elderly subgroup. (C, F, and I) Kaplan–Meier curve corresponding to the cutoff point for the whole group, the young elderly subgroup, and the old elderly subgroup.
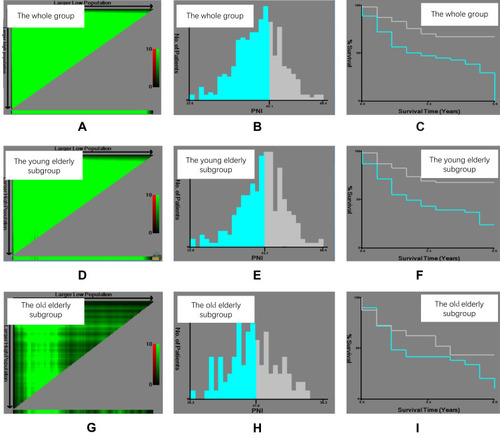
Table 1 Clinical Characteristics of the Low- and High-PNI Groups (n = 454)
Figure 3 Survival analysis based on PNI level. ROC curves for postoperative survival and Kaplan–Meier curves of postoperative survival based on PNI levels. (A and B) represent the whole group. (C and D) represent the young elderly subgroup (60 years ≥ age >74 years). (E and F) represent the old elderly subgroup (age ≥75 years).
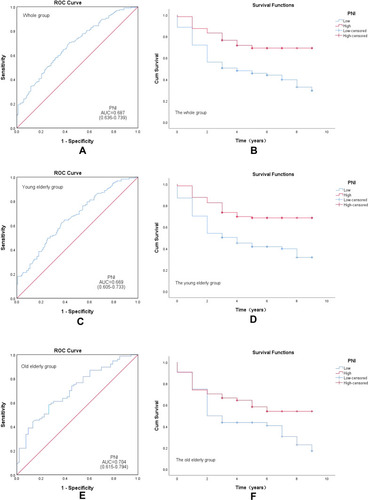
Table 2 Univariate and Multivariate Cox Proportional Hazard of Long-Term Mortality
Table 3 Multivariate Cox Proportional Hazard of Long-Term Mortality According to Subgroup