
Figures & data
Table 1 The Characteristics of All the Patients and the Comparison of the CR/CRi and the NR Patients
Table 2 Gene Mutations of All the Patients (Purple Boxes Represent That the Corresponding Gene Mutation is Positive)
Figure 1 The one-year overall survival (OS) rate of 22 patients was 31.8%, and the median survival time was 6 months (95% CI, 1–9 months).
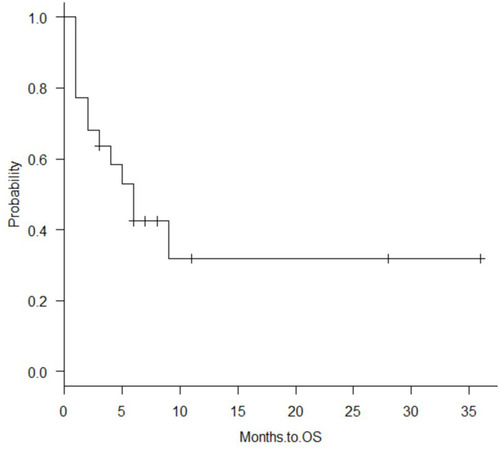
Figure 2 The one-year overall survival rate of 10 CR/CRi patients was 59.1%, and the 12 NR patients was 10.4%, and there were statistical differences between the two groups (P=0.001).
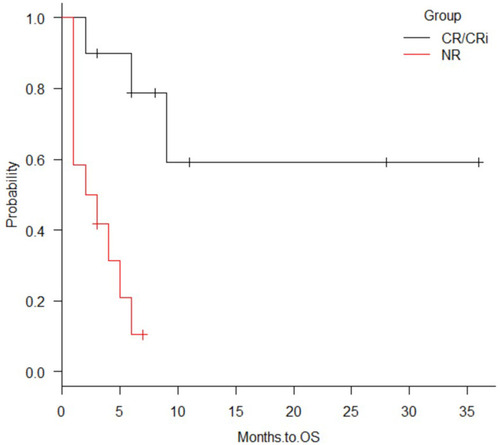
Figure 3 Remission and survival of the 22 patients.
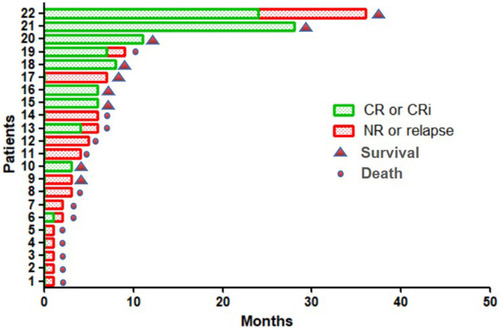
Table 3 Predictive Gene Mutation in the Literatures