
Figures & data
Figure 1 Analysis of TCGA database. (A) The database erases the volcanic map of the genes that differ from the normal sample. (B) Determination of soft threshold (β) for weighted gene co-expression network analysis. (C) Gene cluster dendrogram. (D) Heat map of correlation between clinical features and module features. (E) Go histogram of co-expression differential genes. (F) KEGG histogram of co-expression differential genes.
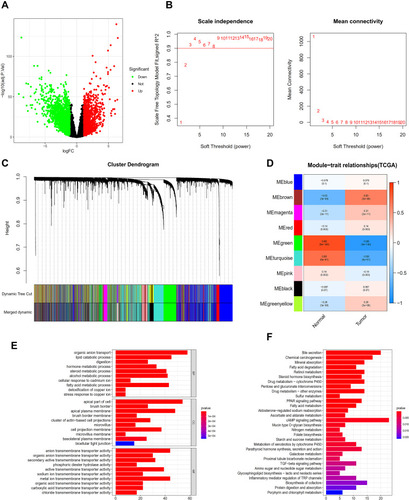
Figure 2 VENN. (A) DEGs of the most significant down-regulated module in the TCGA database. (B) DEGs of the most significant down-regulated module in the TCGA database. (C) DEGs of the most significant down-regulated module in the TCGA database. (D) DEGs were co-expressed in three databases.
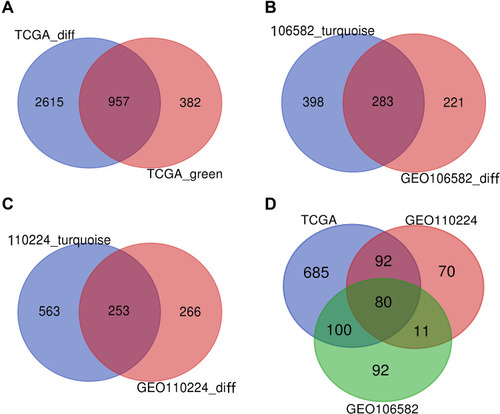
Figure 3 Analysis of GEO database: (A–F) Analysis of GSE106582 database (The figures type are the same as database TCGA). (G–L) Analysis of GSE110224 database (The figures type are the same as database TCGA).
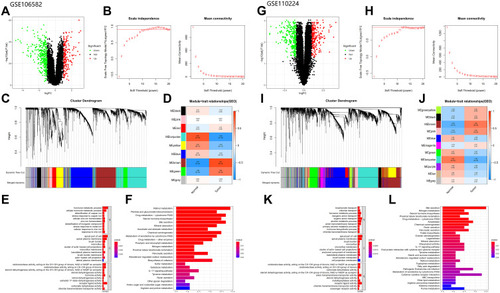
Figure 4 (A–D) The survival curves of continuous variables of key genes. (E–L) Scatter plots and paired plots of gene expression differences of key genes.
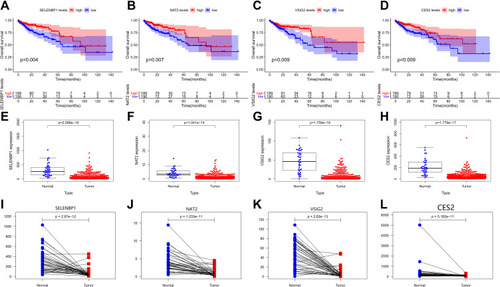
Figure 5 (A) Correlation between VSIG2 and immune cells. (B) Correlation of VSIG2 with tumor-associated M1 macrophage markers. (C) correlation of VSIG2 with tumor-associated M2 macrophage markers.
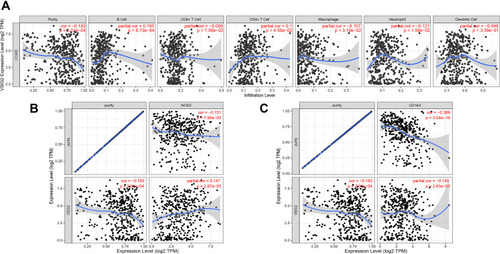
Table 1 Expression of VSIG2 in Immune Cells of Cancer and Normal Tissues
Figure 6 (A) The expression of VSIG2 in normal tissues. (B) The expression of VSIG2 in cancer tissues. (C) The expression of LC3 in cancer tissues.
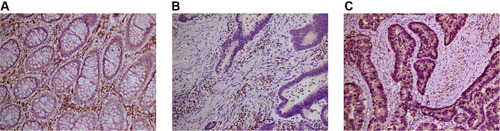
Table 2 Correlation Between the Expression of VSIG2 in Immune Cells of Cancer Tissue and the Intensity of Immune Invasion
Table 3 Correlation Between Autophagy - Related Factor LC3 and the Intensity of Immune Invasion in Cancer Tissue
Table 4 Correlation Between the Expression of LC3 and VSIG2 and the Intensity of Immune Invasion