Figures & data
Table 1 Clinical Data of the 122 Breast Cancer Patients
Figure 1 Positive expression of MAGE-A/NY-ESO-1 in breast cancer tissues.
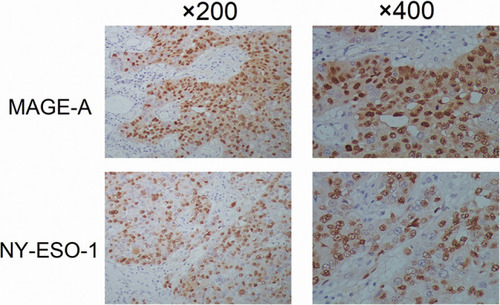
Figure 2 (A and B) Chi-square or Fisher’s exact test analysis of associations between expression of MAGE-A/NY-ESO-1 and clinical diagnostic or experimental biomarkers.
Abbreviations: ER, estrogen receptor; PR, progesterone receptor; HER-2, human epidermal growth factor receptor 2; LN, lymph node; MAGE-A, melanoma-antigen family A protein; NY-ESO-1, New York esophageal squamous cell carcinoma-1.
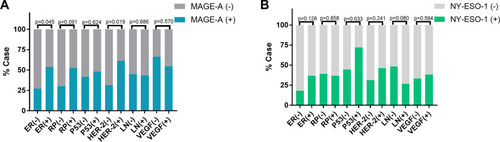
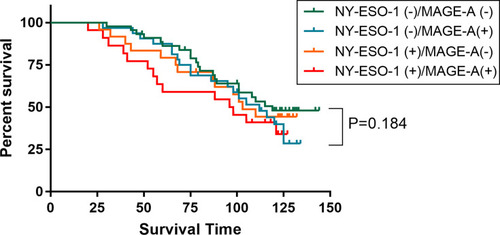
Figure 3 Kaplan–Meier survival analysis of the whole follow-up cohort.