Figures & data
Figure 1 Identification of differentially expressed miRNAs (DEMIs) and differentially expressed genes (DEGs) in tumor tissues and adjacent nontumor tissues from pancreatic cancer patients. (A and C) Volcano plots of DEMIs and DEGs in GEO database. The red dots represent the upregulated genes based on an adjusted p < 0.05 and log FC > 1; the green dots represent the downregulated genes based on an adjusted p < 0.05 and log FC < −1; the black spots represent genes with no significant difference in expression. (B and D) The heat map of down- and upregulated DEMIs and DEGs in the integrated microarray analysis. Each column represents one dataset and each row represents one gene. The number in each rectangle represents the value of log2FC.
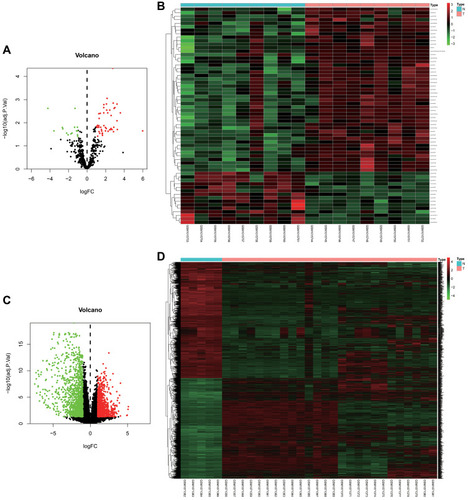
Figure 2 Enriched transcription factors by differentially expressed microRNAs target genes. The top 10 most significant transcription factors include EGR1, SP1, POU2F1, SP4, NKX6-1, RREB1, LHX3, SOX1, FOXA1, HOXA3.
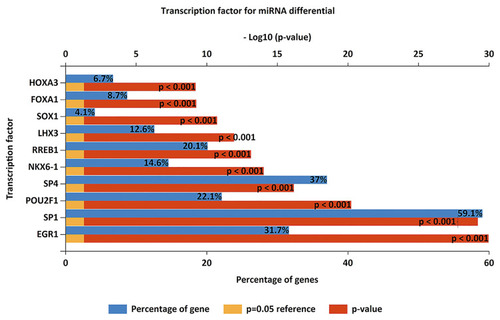
Figure 3 GO enrichment analysis of the DEMIs, (A) biological process. (B) cellular component. (C) molecular function.
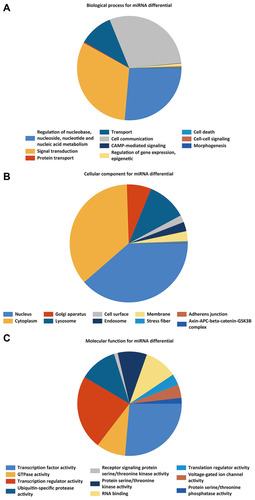
Figure 4 MiRNA–mRNA interaction network of key genes. To integrate the largest linker network in miRNA–mRNA interaction network. The shape of the node represents different types of genes: diamond, DEGs; oval, DEMIs.
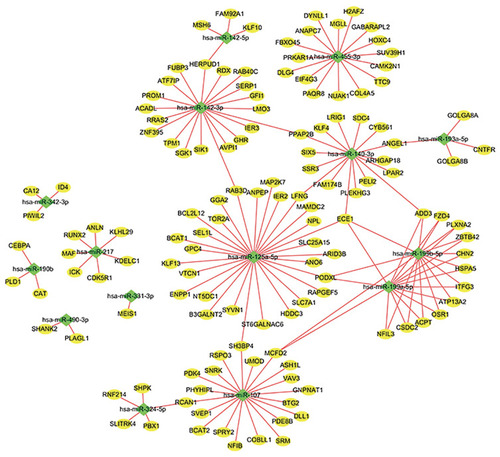
Figure 5 Identification of key miRNAs by evaluating their prognosis in PAAD. (A) miR-217. (B) miR-455-3p.
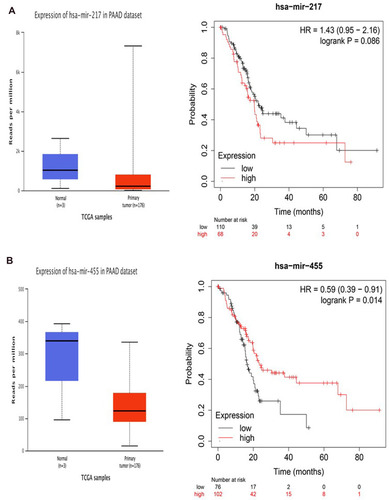
Figure 6 Identification of target mRNAs by evaluating their prognosis in PAAD. (A) HOXC4. (B) DLG4. (C) DYNLL1. (D) MGLL. (E) FBXO45.
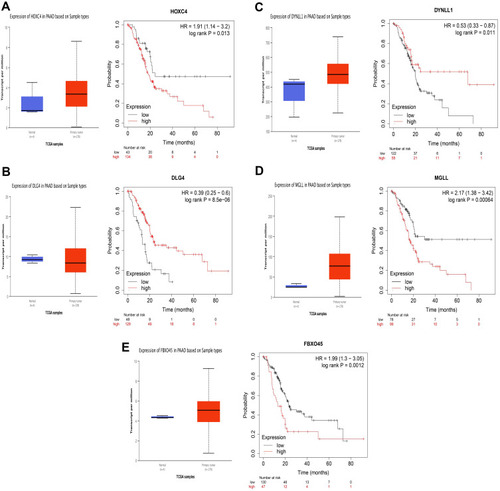
Figure 7 GO functional analysis of target DEGs. (A) Biological process. (B) Cellular component. (C) Molecular function.
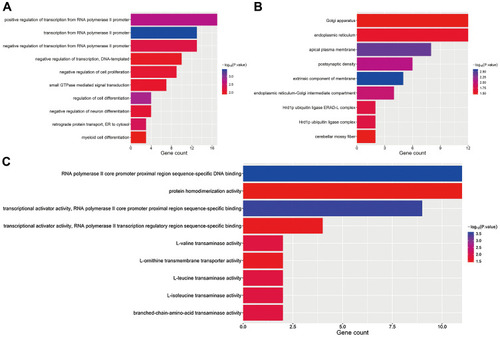
Figure 8 KEGG pathway enrichment analysis.
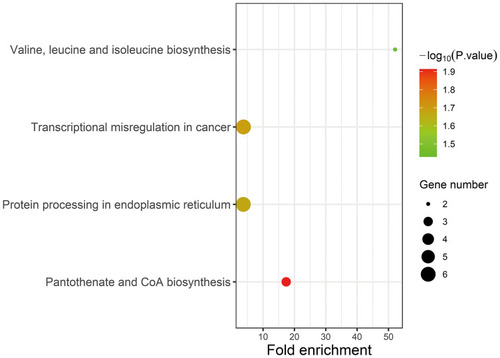
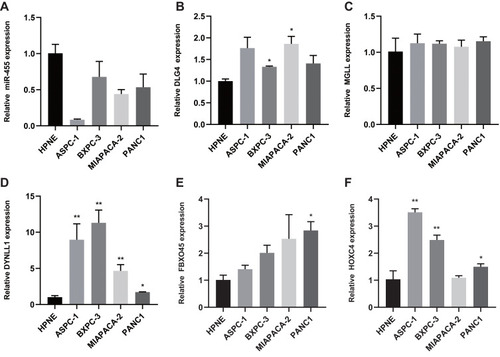
Figure 9 Expression of miRNAs and Target Genes in normal human pancreatic duct epithelial cells and PAAD cell lines. (A) Expression of miR455-3p in normal human pancreatic duct epithelial cells and PAAD cell lines by qRT-PCR. (B–F) qRT-PCR analysis of HOXC4, DLG4, DYNLL1, MGLL, FBXO45 mRNA expression in normal human pancreatic duct epithelial cells and PAAD cell lines (the values represent mean ± SD). The asterisks are used to indicate a statistically significant difference: * p < 0.05; ** p < 0.01.