
Figures & data
Figure 1 Differential gene expression profiles. (A) Volcano plot of DEGs based on 587 samples (552 tumor and 35 adjacent tissue). (B) Volcano plot of DEGs based on 23 paired samples. (C) Venn diagram showing intersection of DEGs obtained by two ways. (D) Forest plot for survival outcome of DEGs based on univariate and multivariable survival analyses.
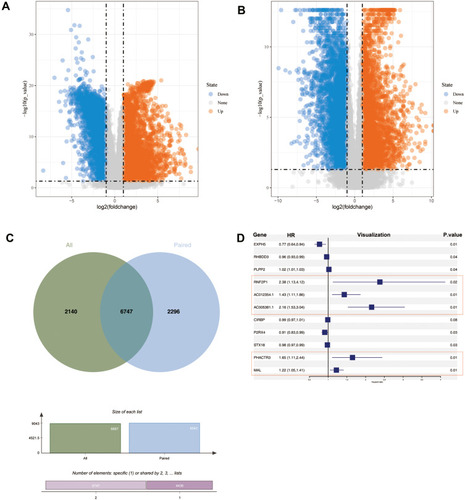
Figure 2 MAL plays an important role in UCEC tumorigenesis and progression. (A) Quantitative analysis of differential gene expression. (B) MAL expression in different tumor stages. (C) Samples were divided into two groups based on expression level of MAL. (D) KM survival curve of MAL. (E) Time-dependent ROC curves for survival prediction. *<0.01, ****<0.00001, ns, not significant.
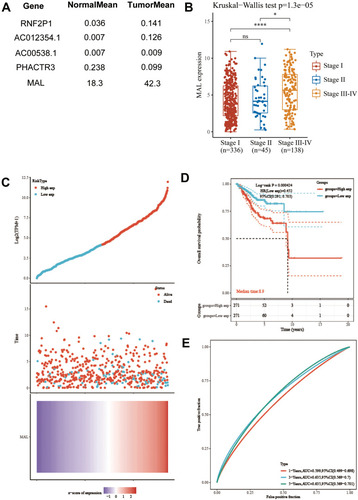
Figure 3 Correlation between MAL expression and levels of immune cells in tumor micro-environment. (A and B) Levels of immune cells in tumor micro-environment in the MAL low and high expression groups. *<0.01, **<0.001, ***<0.0001.
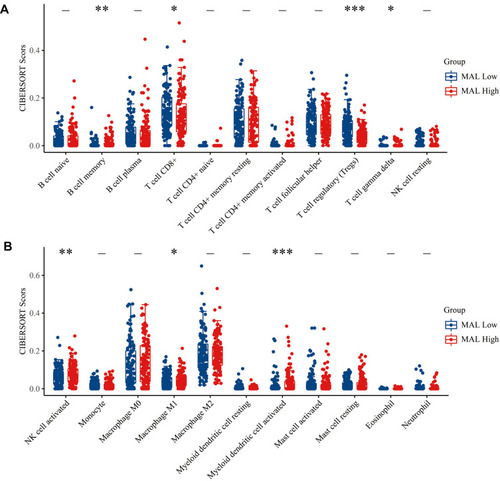
Figure 4 Relationship between MAL expression and immune checkpoints. (A) Immune checkpoint expression levels in MAL expression high group and low expression groups. (B) Scatter plots showing correlation between expression level of MAL and immune checkpoints. **<0.001, ***<0.0001.
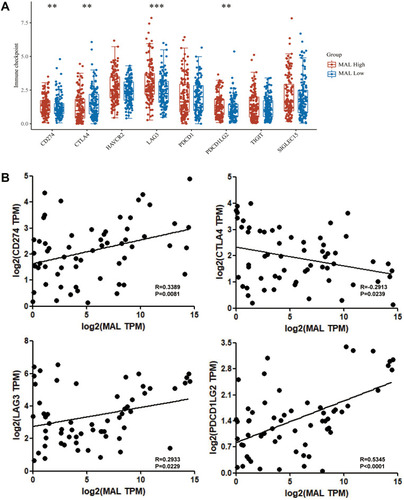
Figure 5 GSVA analysis for tumor and adjacent tissue.
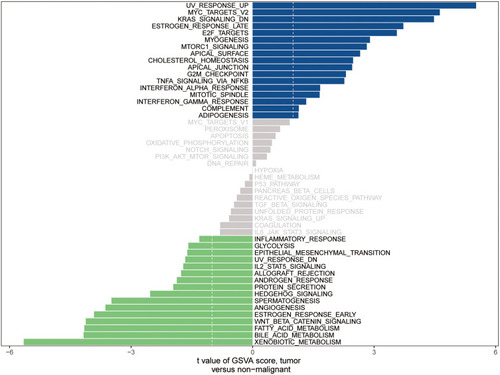
Figure 6 Experimental verification of the prognostic value of MAL. (A) PCR results of the 20 paired UCEC tumor and adjacent tissues. mRNA expression level of MAL in tumor tissues was significantly higher compared with that in adjacent normal tissues. (B) MAL protein level was significantly higher in tumor tissues compared with that in adjacent normal tissues. (C) MAL protein level was significantly higher in UCEC metastasis group compared with the non-metastatic group. (D) Representative pictures of UCEC in tissue microarray analyzed using IHC. (E and F) MAL high expression group was associated with worse overall survival and progression free survival.
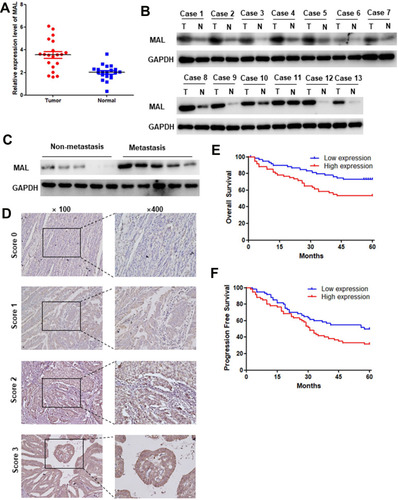
Table 1 Correlations Between Expression Level of MAL and Clinicopathological Features in 120 UCEC Patients