
Figures & data
Table 1 PICO (Patient, Intervention, Comparison, Outcome) Method Keywords Used to Search the Literature on Cost-Effectiveness Analysis of Active Surveillance versus Early Surgery in Papillary Thyroid Cancer
Figure 1 Among 62 searched papers, 5 papers were selected. Papers that had irrelevant titles, were written in foreign languages, or were review articles without original results were excluded.
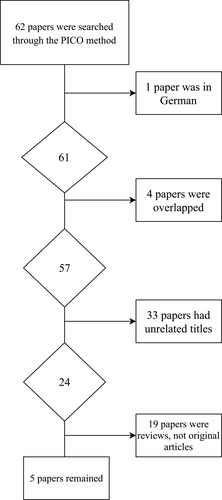
Figure 2 Decision tree example. Each node can represent decision options (such as whether to opt for a particular treatment) and it is connected to branches. The chance of going down one branch versus another is decided by the probabilities of events estimated with data. “P” represents the probabilities.
Notes: Adapted from: 2011 Medical Economic Evaluation Guideline. Health Insurance Review & Assessment Service (HIRA); 2016. Available from: http://www.hira.or.kr/cms/participation/05/07/__icsFiles/afieldfile/2013/04/01/3.pdf. Korean. 2016 Copyright HIRA.Citation31
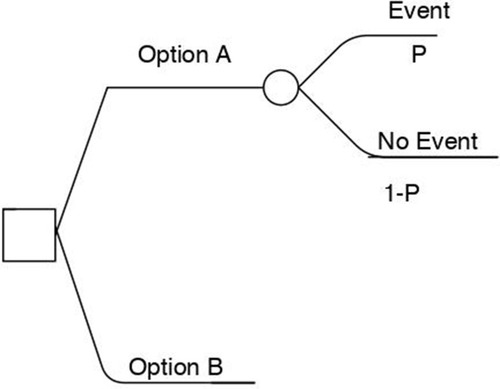
Figure 3 Markov model example. Each circle represents a specific medical condition. “P” represents the probability that a medical event can happen.
Notes: Adapted from: 2011 Medical Economic Evaluation Guideline. Health Insurance Review & Assessment Service (HIRA); 2016. Available from: www.hira.or.kr. Korean. 2016 Copyright HIRA.Citation31
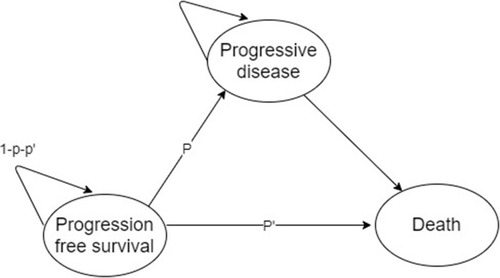
Table 2 Selected Five Key Papers About Cost-Effectiveness Analysis of Active Surveillance versus Early Surgery in Papillary Thyroid Cancer
Table 3 Utility Score of the Three Key Reference Papers About Cost-Effectiveness Analysis of Active Surveillance versus Early Surgery in Papillary Thyroid Cancer
Table 4 Method of Modeling, Cost Sources, Utility Source, and Validation Level of Selected Papers
Table 5 Costs Mentioned in the Five Key Reference Papers on Cost-Effectiveness Analysis of Active Surveillance versus Early Surgery in Papillary Thyroid Cancer