
Figures & data
Table 1 Clinicopathologic Parameters of the 231 ESCC Patients
Figure 1 The mRNA expression level of PABPC1 in ESCC.
Notes: The mRNA expression levels of PABPC1 in total ESCC and their paired adjacent normal tissues (control) (A); the mRNA expression level of PABPC1 was increased in ESCC with high PABPC1 expression, but decreased in ESCC with low PABPC1 expression, compared to that of the control (B). Student’s t test was used for significance analysis (two-tailed), and p<0.05 was considered statistically significant. Abbreviation: ESCC, esophageal squamous cell carcinoma.
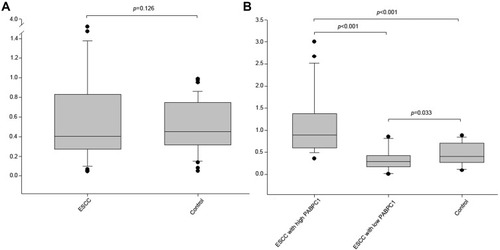
Table 2 Relationship Analyses Among PABPC1 Expression and Clinicopathologic Parameters in ESCC Tissues
Figure 2 Immunohistochemical staining of PABPC1 in ESCC.
Notes: Representative images of PABPC1 staining with low expression (A, C) and high expression (E) in ESCC tissues and their paired adjacent normal epithelium tissues (B,D, F, respectively). Abbreviation: ESCC, esophageal squamous cell carcinoma.
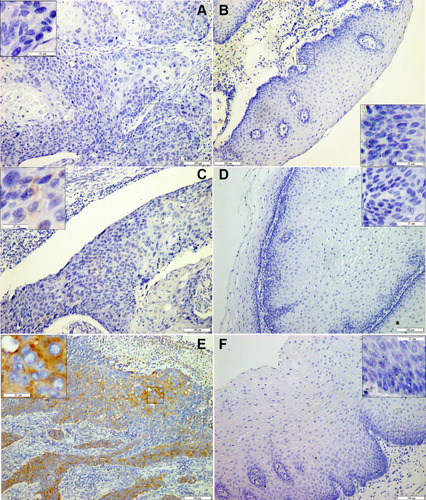
Figure 3 Ki-67, p53, nm23, and PABPC1 in the outcome prediction of the patient with ESCC.
Notes: Kaplan-Meier analyses revealed that high expression of PABPC1 was correlated with poor OS in total ESCC specimens (A); expression of Ki-67, p53, and nm23 was not correlated with poor OS in total ESCC specimens (B-D); high expression of PABPC1 was correlated with poor OS in early-staged (pStage-I,-II) ESCC specimens (E) and advanced (pStage-III, -IV) ESCC specimens (I); expression of Ki-67, p53, and nm23 was not correlated with poor OS in early-staged (pStage-I,-II) ESCC specimens (F, G, H, respectively) or advanced (pStage-III, -IV) ESCC specimens (J, K, L, respectively). Abbreviations: ESCC, esophageal squamous cell carcinoma; OS, overall survival.
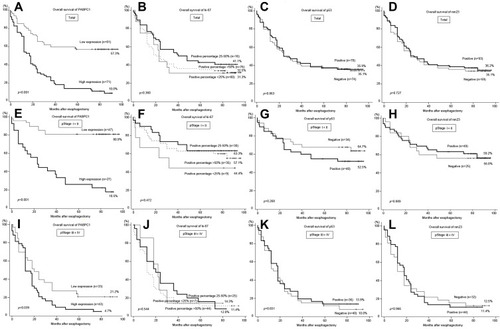
Table 3 Analysis of Prognostic Factors Using Univariate and Multivariate Analyses Among the 152 Followed-Up ESCC Patients