Figures & data
Figure 1 Flowchart.
Note: This nested case–control study was based on a multicenter clinical investigation.
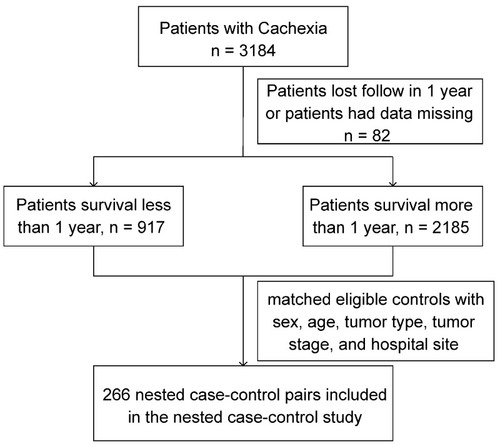
Table 1 Detailed Baseline Characteristics of the Study Population
Table 2 Association of 1-Year Survival in Patients with Cancer Cachexia and Albumin Concentration
Table 3 Association of 1-Year Survival in Patients with Cancer Cachexia and Total Protein Concentration
Figure 2 The association of albumin (A and B) and total protein (C and D) with 1-year survival in patients with cancer cachexia.
Notes: (A) Unadjusted model: p<0.001; OR: 0.90; 95% CI: 0.87,0.93; (B) Adjusted model p<0.001; adjusted OR: 0.92; 95% CI: 0.89,0.95; (C) Unadjusted model: p<0.001; OR: 0.96; 95% CI: 0.94,0.98; (D) Adjusted model p=0.005; adjusted OR: 0.97; 95% CI: 0.94, 0.99. Adjusted for PLT, lymphocyte count, TSF, treatment, and nutrition support.
Abbreviations: PLT, platelet; TSF, triceps skin fold; CI, confidence interval; OR, odds ratio.
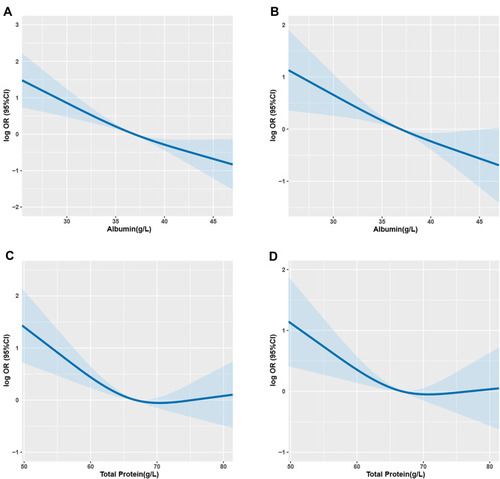
Figure 3 The association of albumin (A) and total protein (B) with the risk of 1-year survival in patients with cancer cachexia in various subgroups.
Notes: The albumin and total protein were analyzed as continuous variables. Adjusted for PLT, lymphocyte count, TSF, treatment and nutrition support.
Abbreviations: Hb, hemoglobin; WBC, white blood cell; RBC, red blood cell; PLT, platelet; BMI, body mass index; MAC, mid-arm circumference; TSF, triceps skin fold; HGS, handgrip strength; CC, calf circumference.
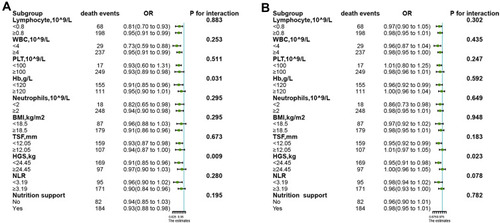
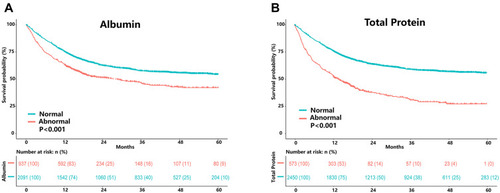
Figure 4 Results of the Kaplan–Meier survival analysis for patients with cancer cachexia stratified by albumin (A) and total protein (B) based on all patients with cancer cachexia.
Notes: (A) Based on all patients with cancer cachexia (n=3032). (B) Based on all patients with cancer cachexia (n=3027).