Figures & data
Figure 1 The expression levels of PRDX family of normal tissues (blue) and tumor tissues (red) in OSCC (TCGA cohort). (A) PRDX1; (B) PRDX2; (C) PRDX3; (D) PRDX4; (E) PRDX5; (F) PRDX6. (*P<0.05; **P<0.01)
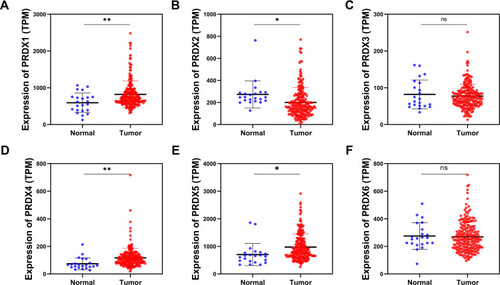
Figure 2 The expression levels of PRDX family of non-metastasis group (blue) and metastasis group (red) in OSCC (TCGA cohort). (A) PRDX1; (B) PRDX2; (C) PRDX3; (D) PRDX4; (E) PRDX5; (F) PRDX6. (*P<0.05; ***P<0.001)
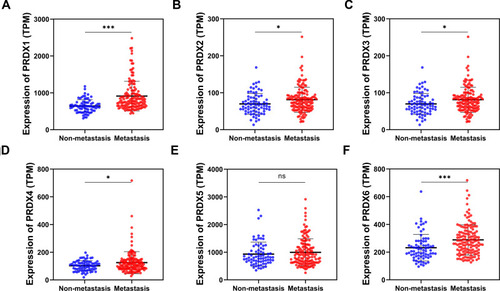
Figure 3 The role of PRDXs in the overall survival and prognosis in patients with OSCC (TCGA cohort). (A–F) Kaplan–Meier method and the Log rank test for PRDXs; (G) Cox proportional hazards regression analysis for PRDXs.
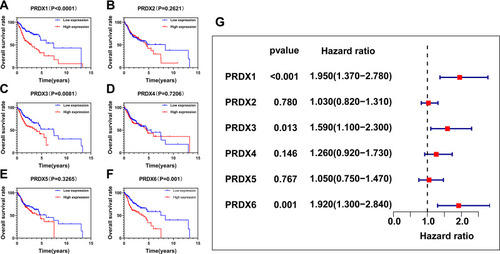
Figure 4 The expression level of PRDX1 in ANTs and OSCC tissues and the relationship between PRDX1 level and overall survival in patients with OSCC (testing cohort). (A) mRNA expression of PRDX1 by qRT‐PCR; (B) Survival analysis by Kaplan-Meier method; (C and D) Protein expression of PRDX1 by Western blot. (**P<0.01)
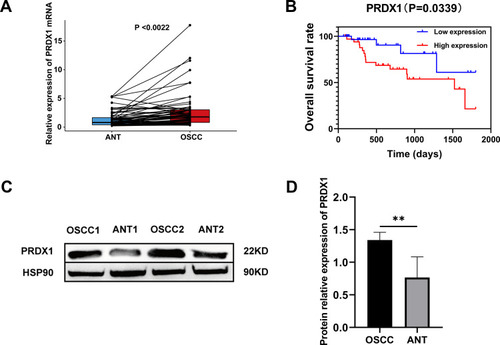
Figure 5 The expression level of PRDX1 in different N stages, tumor stages, and pathological grades. (A) N stage in TCGA cohort; (B) Tumor stage in TCGA cohort; (C) Pathological grade in TCGA cohort; (D) N stage in testing cohort; (E) Tumor stage in testing cohort; (F) Pathological grade in testing cohort. (*P<0.05; **P<0.01; ***P<0.001)
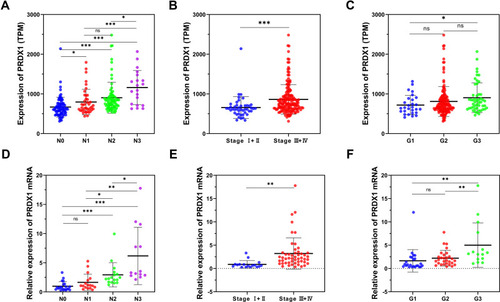
Figure 6 The relationship between PRDX1 level and N stage and pathological grade was further verified by Western blot and IHC staining. (A and B) the expression level of PRDX1 in different N stage by western bolt; (C–F) the expression level of PRDX1 in different pathological grade by IHC staining. (*P<0.05; **P<0.01)
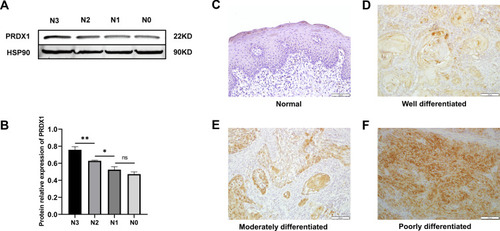
Table 1 Correlation Between Expression Level of PRDX1and Clinical Characteristics in TCGA Cohort
Table 2 Correlation Between Expression Level of PRDX1and Clinical Characteristics in Testing Cohort
Figure 7 The establishment of a nomogram that can predict the 1-, 3-, and 5-year survival rates of patients with OSCC. (A) Cox proportional hazards regression analysis for PRDX1 and clinical features; (B) A nomogram containing Tumor stage, N stage and PRDX1 level; (C and D) The accuracy of nomogram in the TCGA cohort and testing cohort was verified by the ROC curve.
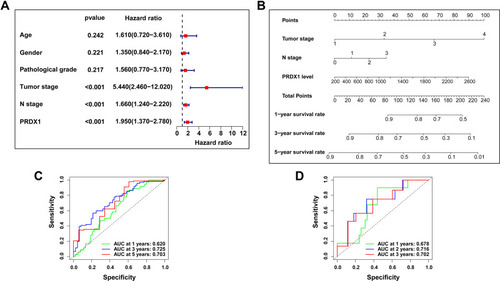
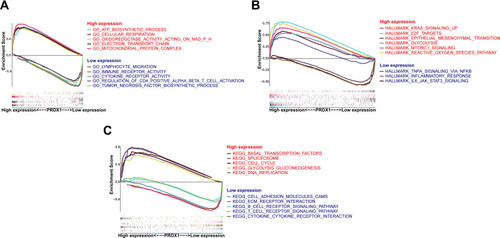
Figure 8 GSEA results showed the molecular mechanism of PRDX1 in OSCC. (A) GO; (B) Hallmarks; (C) KEGG pathways.