Figures & data
Table 1 Baseline Characteristics of 530 ICC Patients Who Underwent Hepatectomy
Table 2 Correlation Between CAC Grade and Clinicopathological Characteristics in the Derivation Cohort
Figure 1 The flow-chart of patient selection.
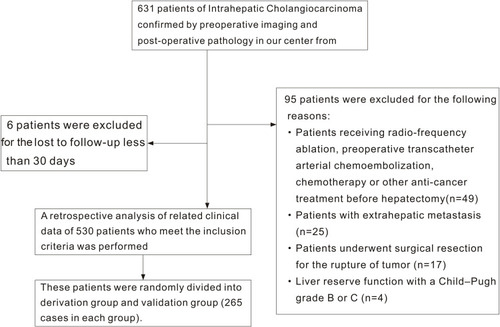
Table 3 Cox Regression Analysis for OS of ICC Patients in the Derivation Cohort
Table 4 Cox Regression Analysis for DFS of ICC Patients in the Derivation Cohort
Figure 2 Kaplan-Meier curves for DFS and OS stratified by ALRI (A and D), CA19-9 (B and E), and CAC grade (C and F) in the derivation cohort.
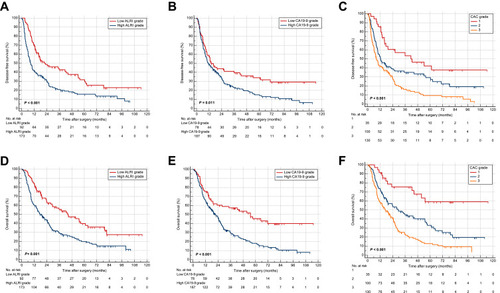
Figure 3 Kaplan-Meier curves for DFS and OS stratified by ALRI (A and D), CA19-9 (B and E), and CAC grade (C and F) in the validation cohort.
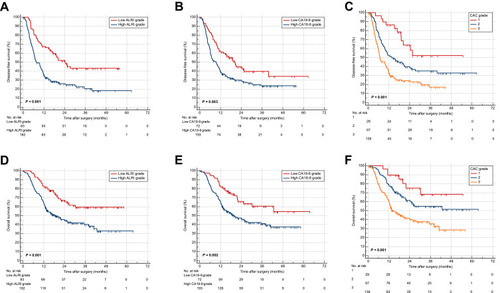
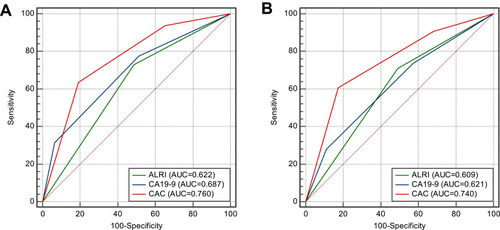
Figure 4 Comparison of AUCs of ALRI, CA19-9 and CAC grade in predicting OS (A) and DFS (B) in the derivation cohort.