
Figures & data
Table 1 Patients Characteristics
Table 2 The Correlation Between UBE2C, or AGGF1, or VM, or MVD and Clinicopathological Characteristics in NSCLC
Figure 1 Immunostaining of UBE2C, AGGF1, VM and MVD in NSCLC and control tissues. (A) Positive staining of UBE2C in NSCLC tissues (×400). (B) Negative staining of UBE2C in control tissues (×400). (C) Positive staining of AGGF1 in NSCLC tissues (×400). (D) Negative staining of AGGF1 in control tissues (×400). (E) Positive staining of VM in NSCLC tissues (×400). (F) Negative staining of VM in control tissues (×400). (G) High MVD in NSCLC tissues (×400). (H) Low MVD in control tissues (×400).
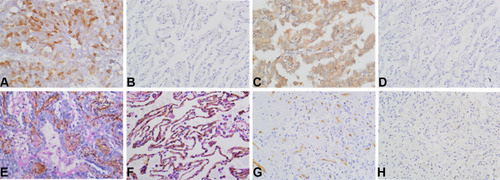
Table 3 Correlation Among UBE2C, AGGF1, VM, and MVD in NSCLC
Figure 2 Kaplan-Meier analysis of OS in NSCLC patients. (A) Correlation between OS and UBE2C (χ2 = 49.521, P < 0.001). (B) Correlation between OS and AGGF1 (χ2 = 23.383, P < 0.001). (C) Correlation between OS and VM (χ2 = 86.409, P < 0.001). (D) Correlation between OS and MVD (χ2 = 73.650, P < 0.001). (E) Correlation between OS and LNM (χ2 = 43.688, P < 0.001). (F) Correlation between OS and TNM stage (χ2 = 53.170, P < 0.001).
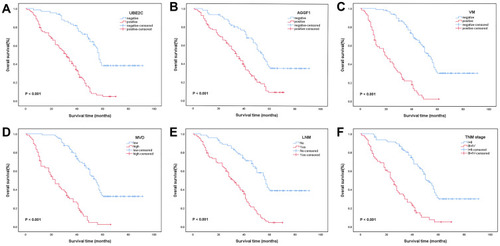
Figure 3 Kaplan-Meier analysis of DFS in NSCLC patients. (A) Correlation between DFS and UBE2C (χ2 = 46.156, P < 0.001). (B) Correlation between DFS and AGGF1 (χ2 = 20.113, P < 0.001). (C) Correlation between DFS and VM (χ2 = 86.340, P < 0.001). (D) Correlation between DFS and MVD (χ2 = 69.609, P < 0.001). (E) Correlation between DFS and LNM (χ2 = 44.624, P < 0.001). (F) Correlation between DFS and TNM stage (χ2 = 53.613, P < 0.001).
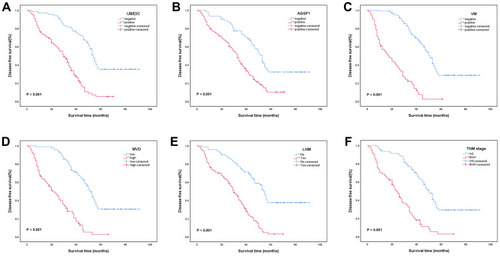
Table 4 Univariate and Multivariate Analysis of OS and Clinicopathological Variables
Table 5 Univariate and Multivariate Analysis of DFS and Clinicopathological Variables