Figures & data
Table 1 Patient Characteristics
Table 2 The MRI Features in the 118 Cases of LVMs
Table 3 Univariate and Multivariate Analysis of WHO Grade
Figure 1 MRI images of typical WHO I (A–D), WHO II (E–H) and WHO III (I–L) of LVM. Most MRI images show mixed-intense and heterogeneous enhancement. Typical low-grade LVM is relatively more regular and clearer boundary, while high-grade LVM has more obvious peritumoral edema and tissue infiltration. Heterogeneous enhancement and perifocal edema in which MRI sequences are indicated by arrows.
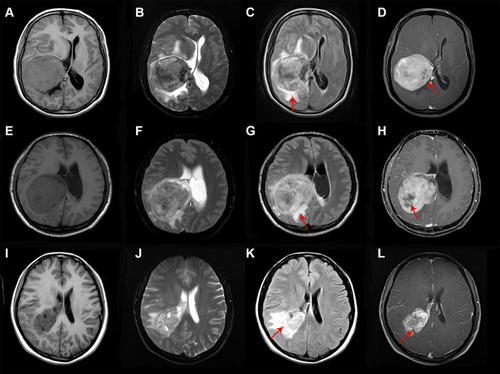
Figure 2 Kaplan-Meier survival curve illustrates the overall survival, and progression-free survival of 195 LVM patients.
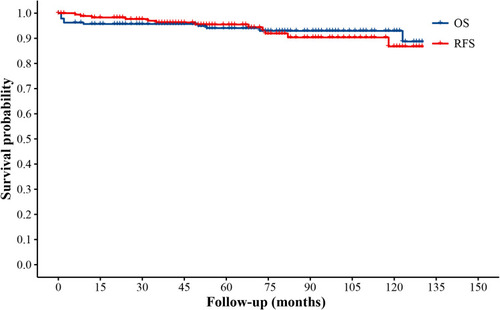
Figure 3 (A) Violin plot illustrating a comparison between the pre- and post-KPS of 85 patients with preoperative KPS score≤80. (B) Violin plot illustrating a comparison between the pre- and post-KPS of all 195 patients.
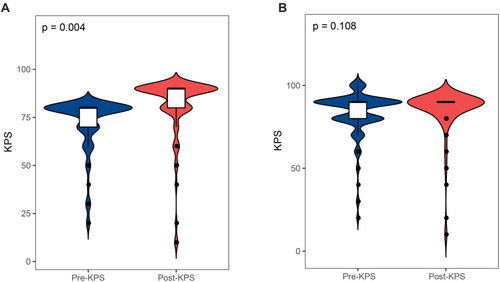
Figure 4 Kaplan-Meier survival analysis illustrating risk factors for OS. A comparison between the OS based on the WHO grade (A), the tumor size (B), the pre-KPS of patients (C), the extent of edema (D), the gender (E), the MRI enhancement (F).
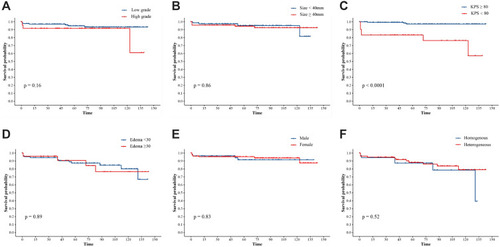
Figure 5 Kaplan-Meier survival analysis illustrating risk factors for recurrence. A comparison between the OS based on the WHO grade (A), the tumor size (B), the extent of resection (C), the extent of edema (D), the gender (E), the hospital day (F).
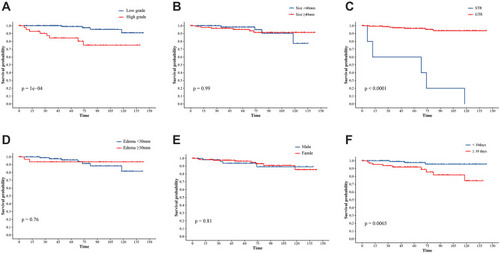
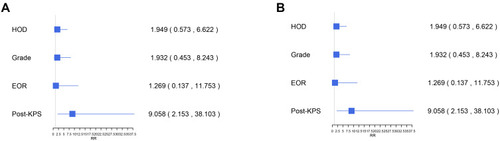
Figure 6 The result of multivariate Cox regression analysis. HR for risk of OS (A) and recurrence (B) the blue squares indicate the HR or OR values, and error bars represent 95% CIs.