Figures & data
Figure 1 Identification of DE-miRNAs between ovarian cancer primary tumour tissues and ascites-derived tumour cells. (A) Information for the 3 selected HGSOC patients. (B) Volcano plot of the DE-miRNAs. The red and green dots represent the upregulated and downregulated DE-miRNAs in ascites-derived ovarian cancer cells, respectively. The black dots represent miRNAs that were not significantly differentially expressed. (C) The miRNA expression values of miR-199a-3p, miR-199b-3p, miRNA-199a-5p, miR-145-5p, miR-126-3p and miR-1245a in ovarian cancer primary tumour tissues and ascites-derived tumour cells of the 3 selected HGSOC patients.
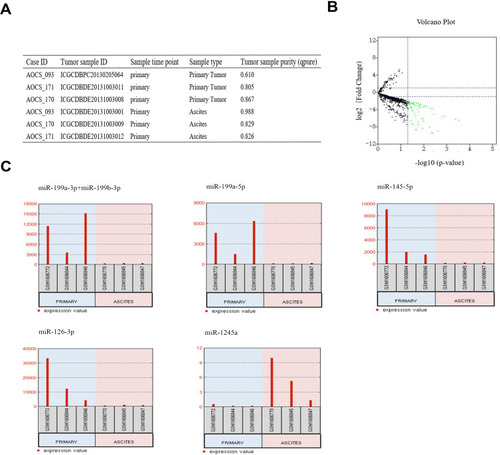
Figure 2 Prediction and functional enrichment of hub target genes of miR-199a-3p, miR-199b-3p, miRNA-199a-5p, miR-145-5p, miR-126-3p. (A) The PPI network of hub target genes of the 5 selected DE-miRNAs. (B) KEGG pathway analysis of the hub target genes of the 5 selected DE-miRNAs. (C–E) GO functions for the hub target genes of the 5 selected DE-miRNAs, including biological process (C), cellular component (D), molecular function (E).
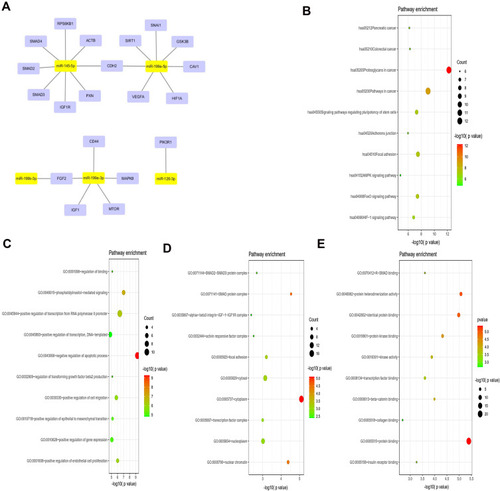
Figure 3 Identification of potential upstream transcription factors of miR-199a-3p, miR-199b-3p, miR-199a-5p, miR-145-5p, miR-126-3p. (A) The network diagram shows the regulation relationships between common TFs predicted by ALGGEN PROMO and TransmiR v2.0 of each pre-miRNA and pre-miRNAs. The molecules in purple square are pre-miRNA and the molecules in yellow ellipse are TFs. (B) The expression change of miR-199a-3p, miR-199b-3p, miR-199a-5p, miR-145-5p, miR-126-3p in 3D-cultured HEY and A2780 after silencing the expression of TFAP2A. When TFAP2A was down-regulated, the expression of miR-199a-3p (p=0.0011 and p=0.0010, respectively), miR-199a-5p (p<0.0010 and p=0.0124, respectively), mi-199b-3p (p=0.0036 and p<0.0010, respectively), miR-145-5p (p=0.0178 and p<0.0010, respectively), miR-126-3p (p<0.0010 and p<0.0096, respectively) was decreased in 3D-cultured HEY cells and A2780 cells respectively. (*p<0.05; **p<0.01; ***p<0.001).
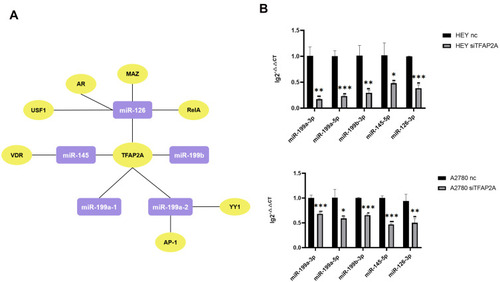
Figure 4 Validation of expression differences of DE-miRNAs between ovarian cancer primary tumours and ascites-derived tumour cells. (A) Expression differences of miR-199a-3p, miR-199b-3p, miRNA-199a-5p, miR-145-5p, miR-126-3p between 12 pairs of ovarian cancer primary tumour tissues and ascites-derived tumour cells from 12 HGSOC patients via quantitative PCR. (**p<0.01; ***p<0.001). (B) Expression differences in miR-199a-3p, miR-199a-5p, mi-199b-3p, miR-145-5p, miR-126-3p expression between adherent cultured (2D) and suspended cultured (3D) cells of the ovarian cancer cell lines HEY and A2780 via quantitative PCR. The expression of miR-199a-3p (p<0.0010), miR-199a-5p (p=0.0094), mi-199b-3p (p=0.0010), miR-145-5p (p=0.0016), miR-126-3p (p=0.0089) was decreased in the 3D-cultured HEY cells compared with that in the 2D-cultured HEY cells. Similarly, compared with the 2D-cultured A2780 cells, the expression of miR-199a-3p (p=0.0052), miR-199b-3p (p=0.0334), miR-145-5p (p=0.0253), miR-126-3p (p=0.0268) was reduced in the 3D-cultured A2780 cells. (*p<0.05; **p<0.01; ***p<0.001).
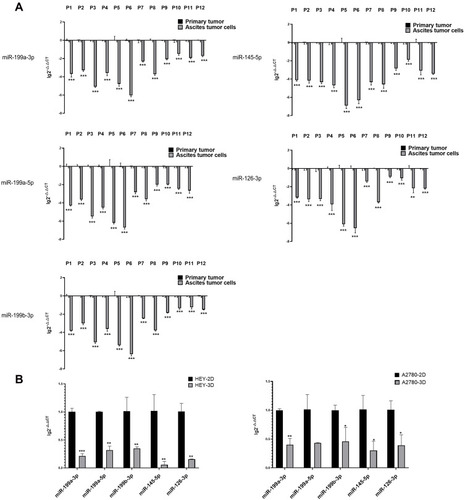
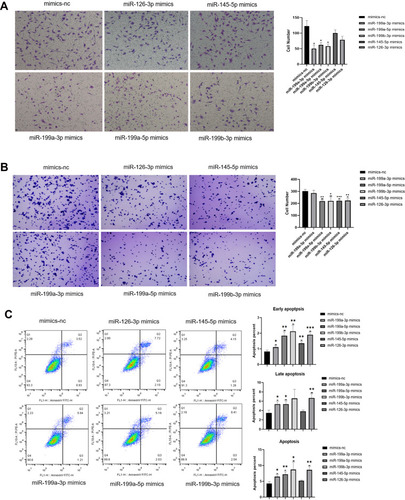
Figure 5 Effects of miR-199a-3p, miR-199b-3p, miR-199a-5p, miR-145-5p and miR-126-3p on invasive, adhesive and apoptosis abilities of ovarian cancer cells. (A–C) The results of transwell invasion assay (A), adherent assay (B) and apoptosis assay (C) results showing the changes in the invasive, adherent and apoptosis abilities of 3D-cultured HEY cells after overexpressing miR-199a-3p, miR-199b-3p, miR-199a-5p, miR-145-5p and miR-126-3p respectively compared with the negative control. (*p<0.05; **p<0.01; ***p<0.001). (A) The invasion abilities of the 3D-cultured HEY cells were reduced after overexpressing miR-199a-3p (p=0.0398), miR-199a-5p (p=0.0486) and miR-199b-3p (p=0.0409), respectively. (B) The adherent abilities of the 3D-cultured HEY cells were weakened after overexpressing miR-199a-5p (p=0.0010), miR-199b-3p (p=0.0171), miR-145-5p (p<0.0010) and miR-126-3p (p=0.0028). (C) Early apoptosis was increased in the 3D-cultured HEY cells after overexpressing miR-199a-3p (p=0.0202), miR-199a-5p (p=0.0030), miR-199b-3p (p=0.0045), miR-145-5p (p=0.0029) and miR-126-3p (p<0.0010); late apoptosis was increased in the 3D-cultured HEY cells after overexpressing miR-199a-3p (p=0.0164), miR-199a-5p (p=0.0212) and miR-126-3p (p=0.0065); total apoptosis was increased in the 3D-cultured HEY cells after overexpressing miR-199a-3p (p=0.0124), miR-199a-5p (p=0.0077), miR-199b-3p (p=0.0323) and miR-126-3p (p=0.0036).