
Figures & data
Table 1 Clinical Characteristics
Table 2 Surgical Procedures
Figure 1 Kaplan–Meier plots for progression-free survival (A) and overall survival (B) between the laparoscopy and laparotomy groups.
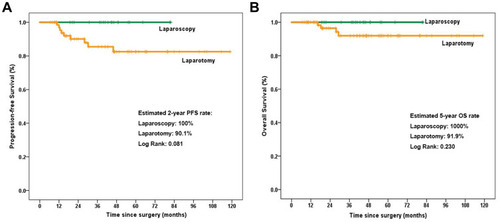
Table 3 Characteristics of Recurrent Patients
Table 4 References Comparing Survival Between Open Surgery and MIS for Ovarian Cancer Patients with Early Stage