
Figures & data
Figure 1 ROC curves for NLR and PLR. The ROC curve for NLR is indicated by the blue line. The ROC curve for PLR is indicated by the green line.
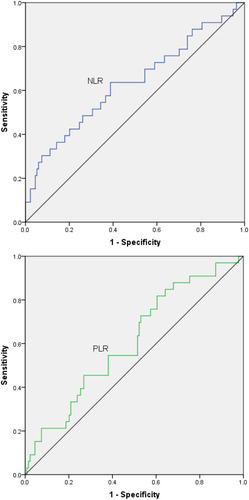
Table 1 Clinicopathological Characteristics of 167 Patients, Grouped by NLR and PLR
Figure 2 Correlation between the NLR and PLR (r = 0.614, P < 0.001).
Abbreviations: NLR, neutrophil lymphocyte ratio; PLR, platelet lymphocyte ratio.
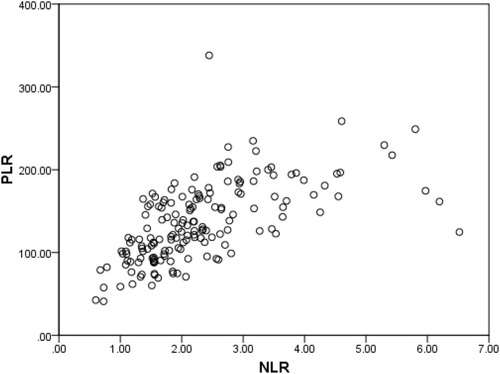
Figure 3 DFS curve grouped by NLR. Patients with high NLR (≥2.20) possessed significantly poorer DFS time compared with patients with low NLR (<2.20; P=0.013).
Abbreviations: DFS, disease-free survival; NLR, neutrophil lymphocyte ratio; Cum., cumulative.
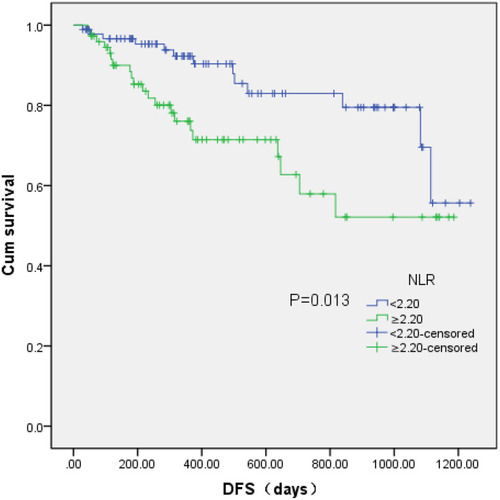
Figure 4 DFS curve grouped by PLR. Patients with high PLR (≥110) possessed significantly poorer DFS time compared with patients with low PLR (<110; P=0.083).
Abbreviations: DFS, disease-free survival; PLR, platelet-to-lymphocyte ratio; Cum., cumulative.

Table 2 Multivariate Analyses in 167 Patients with Resectable Esophageal Squamous Cell Carcinoma