Figures & data
Figure 1 Flow diagram of patient selection.
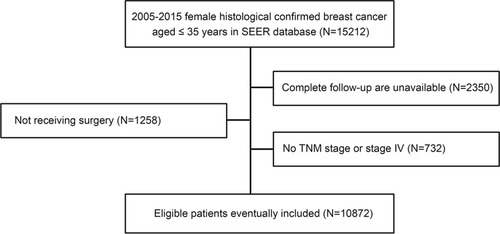
Table 1 Patient Characteristics of the Training Cohort and the Validation Cohort
Figure 2 (A) Univariate and (B) multivariate analysis of overall survival for the training cohort.
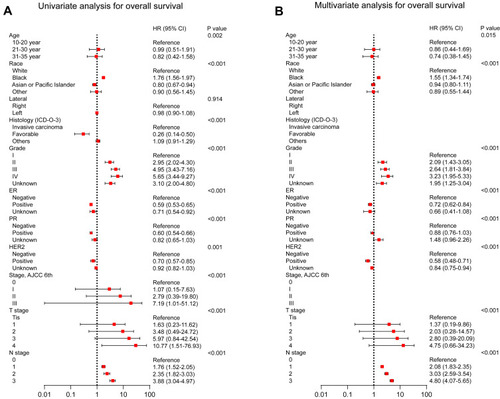
Figure 3 Kaplan-Meier curves for overall survival stratified by (A) race, (B) grade, (C) T stage, and (D) N stage in the training cohort.
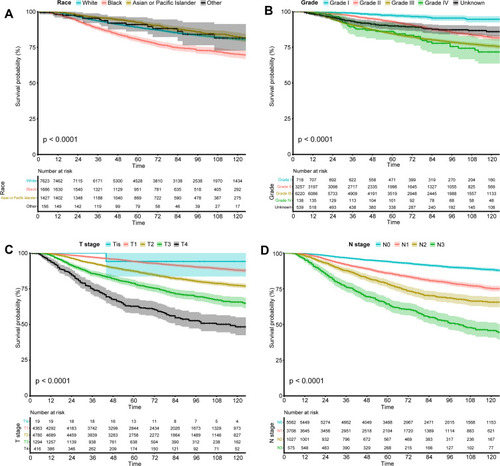
Figure 4 Nomograms predicting 3-, 5-, and 10-year overall survival for the training cohort.
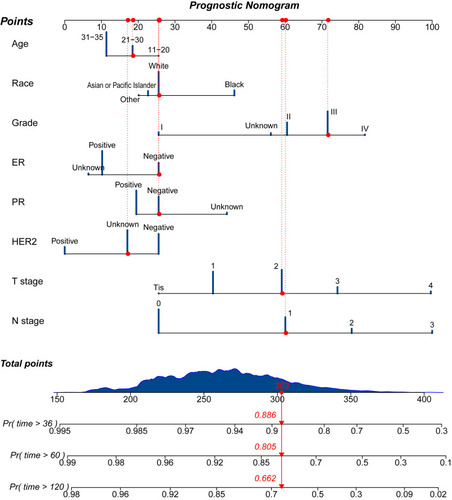
Figure 5 Calibration plots of the nomogram for 3‐, 5‐, and 10-year overall survival (A–C) prediction in the training cohort, and 3‐, 5‐, and 10-year overall survival (D–F) prediction in the validation cohort.
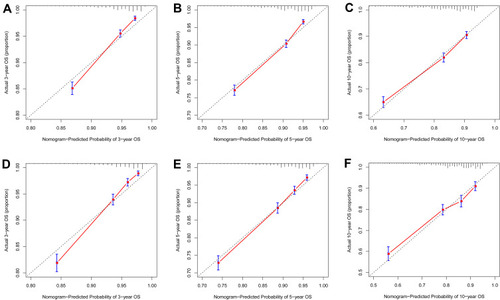
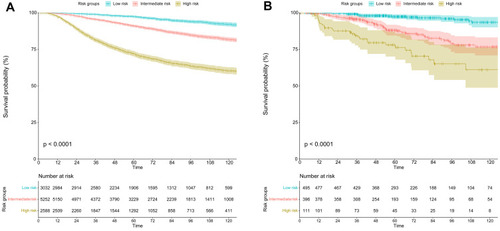
Figure 6 Kaplan-Meier curves for overall survival stratified by risk groups based on total prognostic scores from the nomogram model for (A) the training cohort and (B) the validation cohort.